Harmonizing Veritas and OGMP 2.0: A Unified Protocol for Gas Distribution Networks
A year ago, Veritas and OGMP 2.0 embarked on a collaborative journey to harmonize their
Methods of Estimating Network-Wide Gas Leak Flow Rates - Which is Best for Your Utility?
The key to understanding and tackling the methane emissions problem is to identify, measure, quantify, and reduce the methane emissions from your business activities. Knowing the total emissions volume of your organization is a critical step toward meaningfully reducing emissions and taking credit for those reductions.
This blog will explore two of the industry’s primary methods for reporting on total network emissions and will discuss Picarro’s Network Emissions Measurement1 application and the GIS-based visualization tool, the Network Assessment Viewer.
Top-Down or Bottom-Up?
There are various methods to quantify the leak flow rate when finding leaks within a distribution network. These measurement-based methods range from direct measurement of gas flow from the ground to calculating flow from concentration in the air, all the way to optical imaging techniques.
In a measurement-based approach, once a Distribution System Operator (DSO) calculates the flow rates of individual leaks (top-down method because of the measurement process), the next step is to scale up to site-level, geography-level, and ultimately network-level to produce an organization-scale of methane emissions. Intuitively, scaling up to network quantification levels would be accomplished by summing the flux rates for all found leaks across the network or trying to create an emission factor for the whole network based on measurement summations for a meaningful percentage of the whole. In practice, summation of leaks leads to a result that is far from correct due to the error margin on individual leak measurements for current technologies.
The traditional “top-down” estimate makes large-scale measurements (generally from aerial sources and/or satellites) and/or utilizes a combination of measurements and emission factors for large-scale geographic units, such as entire towns, cities, or regions. This type of top-down assessment can miss emission events that are non-continuous or not attached to a measured area, such as gas from a dairy farm or landfill which has migrated into the survey or image-capture area.
The typical “bottom-up” estimate starts with taking emission factors for small-scale assets, such as pumps, pipes, and meters, and summing the operator’s inventory of assets to get a total emissions volume. The error comes from the inaccuracy of these generic emission factors which are generally unrepresentative of an operator’s specific assets. The most typical current estimation method is based on the EPA GHGI asset emission factors - this method is based on an asset inventory calculation and therefore does not locate individual emitters, making the traditional bottom-up estimates relatively meaningless for accurate emissions reporting or meaningful efforts to achieve net zero.
Top-Down Emission Estimates Through Bottom-Up Calculations
Picarro works diligently with the oil and gas industry to help detect, measure, and reduce emissions through their Emission Measurement application for the P- Cubed® platform. Emissions Measurement allows for a top-down emissions estimate based on actual measurements from point sources, similar to a bottom-up calculation but with far greater accuracy. It uses a unique leak-based, time-averaged approach. This technology is leveraging machine learning to utilize gas measurements over entire networks to provide a very accurate network emissions estimate.
Using Emissions Measurement, operators are able to build a complete inventory of network emissions sources, ranked and binned from .01 SCFH up to 100+ SCFH. The application outputs measurement-based emission factors which are calibrated and optimized for each operator, an enormous step-change over generic emission factors which may be unrepresentative of specific assets.
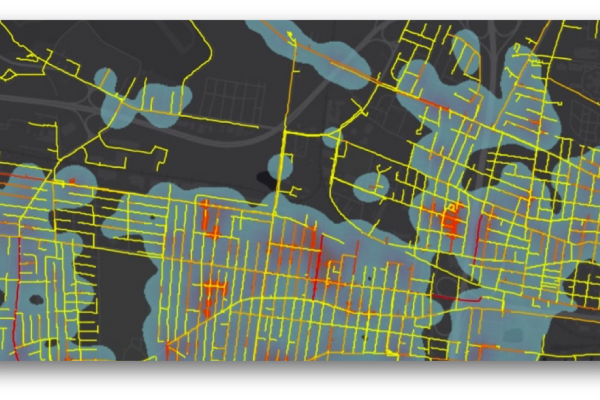
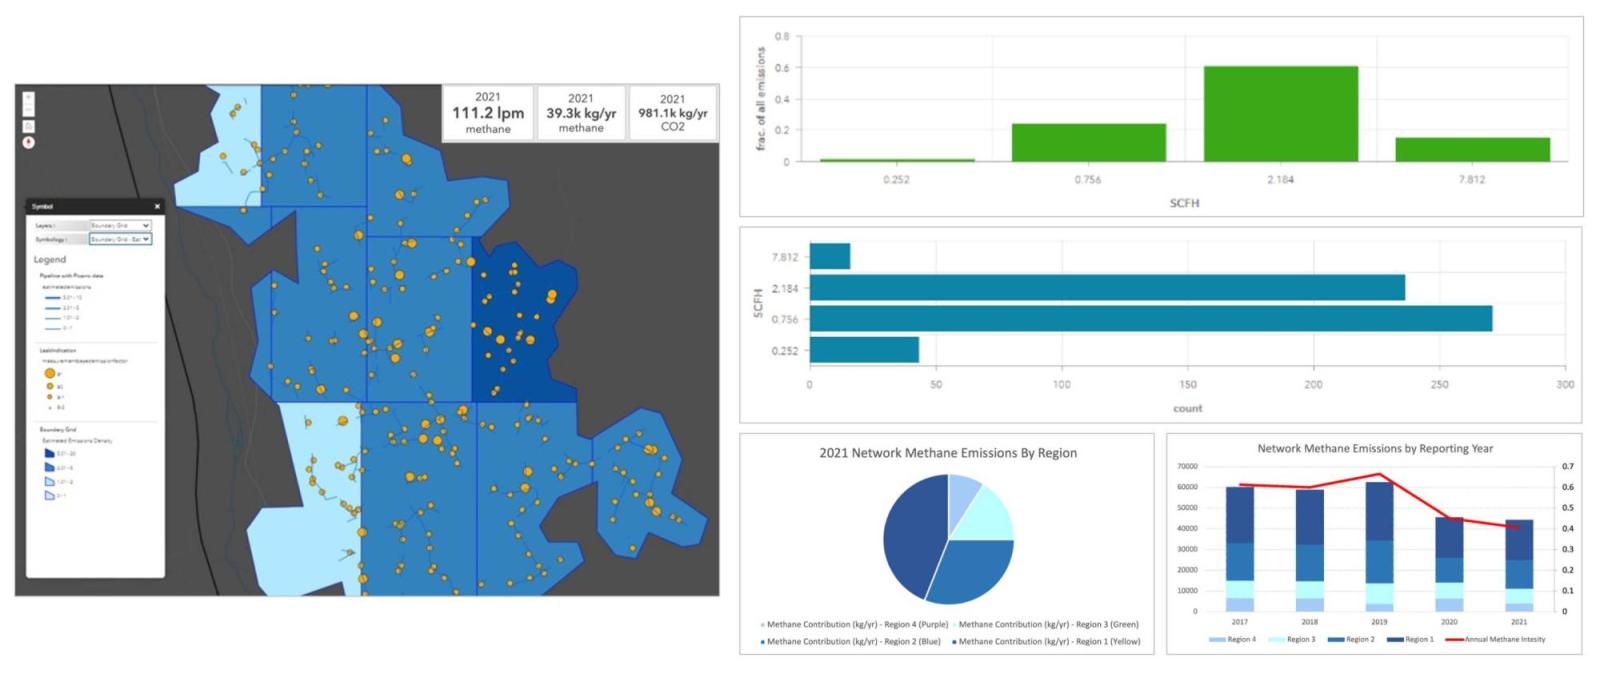
Picarro’s emissions toolset contains a powerful GIS-based visualization tool, Network Assessment Viewer (NAV), an intuitive and interactive representation of all measured methane sources and their flux values in a surveyed gas network. The intuitive interface combined with democratic access to this data in an organization allows utility operators to strengthen their work in emissions measurement and reduction efforts. NAV computes leak and emissions densities and total methane emissions for pipe assets. It further aggregates this data to different geospatial levels, from local to regional, up to the full network scale. See Figure 1.
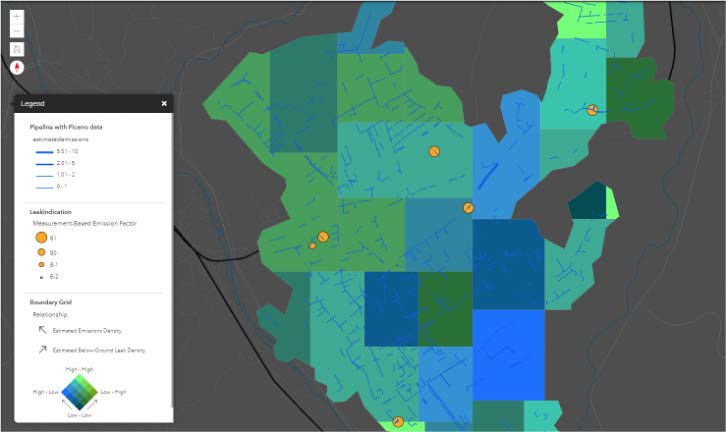
Figure 1. The NAV image shown represents a plot of emissions density versus leak density with high-emitting point sources and pipeline segments overlain. The NAV allows for rapid analysis of complex data in order to make empowered decisions regarding network infrastructure.
What’s In It For Me?
Measuring the entire network annually with Picarro's Network Emissions Measurement application allows DSOs to manage their Environmental, Sustainability, and Governance (ESG) goals and shareholder expectations. It also provides the ability to get ahead of future regulatory reporting requirements through a data-centric network emissions quantification and reporting schema.
As Picarro technology reports complete and accurate network emissions, it is compatible for use in voluntary reporting and measurement methodologies, such as the GTI Veritas Initiative, ONE Future, and Oil and Gas Methane Partnership (OGMP) 2.0.
Emissions measurement and reduction programs must be measurement-based and robust. Picarro’s Emissions Measurement1 solution can help emissions managers account for their total network emissions and empower decisions regarding network infrastructure.
Together, Emissions Measurement and NAV provide an opportunity for your distribution network to achieve Level 4 or Level 5 “Gold Standard” in OGMP 2.0 and the top-tier in many other voluntary reporting programs, such as GTI Veritas and ONE Future.
For more information on Picarro’s direct measurement technology, visit our website at gas.picarro.com
Would you like to read more? Register for the Picarro Gas Community! Gain unlimited access to restricted content including playbooks, technical guides and conference panels.