Over the past few months, I’ve had the privilege of working with collaborators from Penn State, Climmod, Sigma Space, NOAA and others to demonstrate the power of using high precision instruments coupled with advanced modeling techniques to measure greenhouse gas emissions in cities. While many cities are taking a step in the right direction by volunteering to report their emissions estimates, the self-reported numbers are only based on calculations, not on measurements of what is in the air.
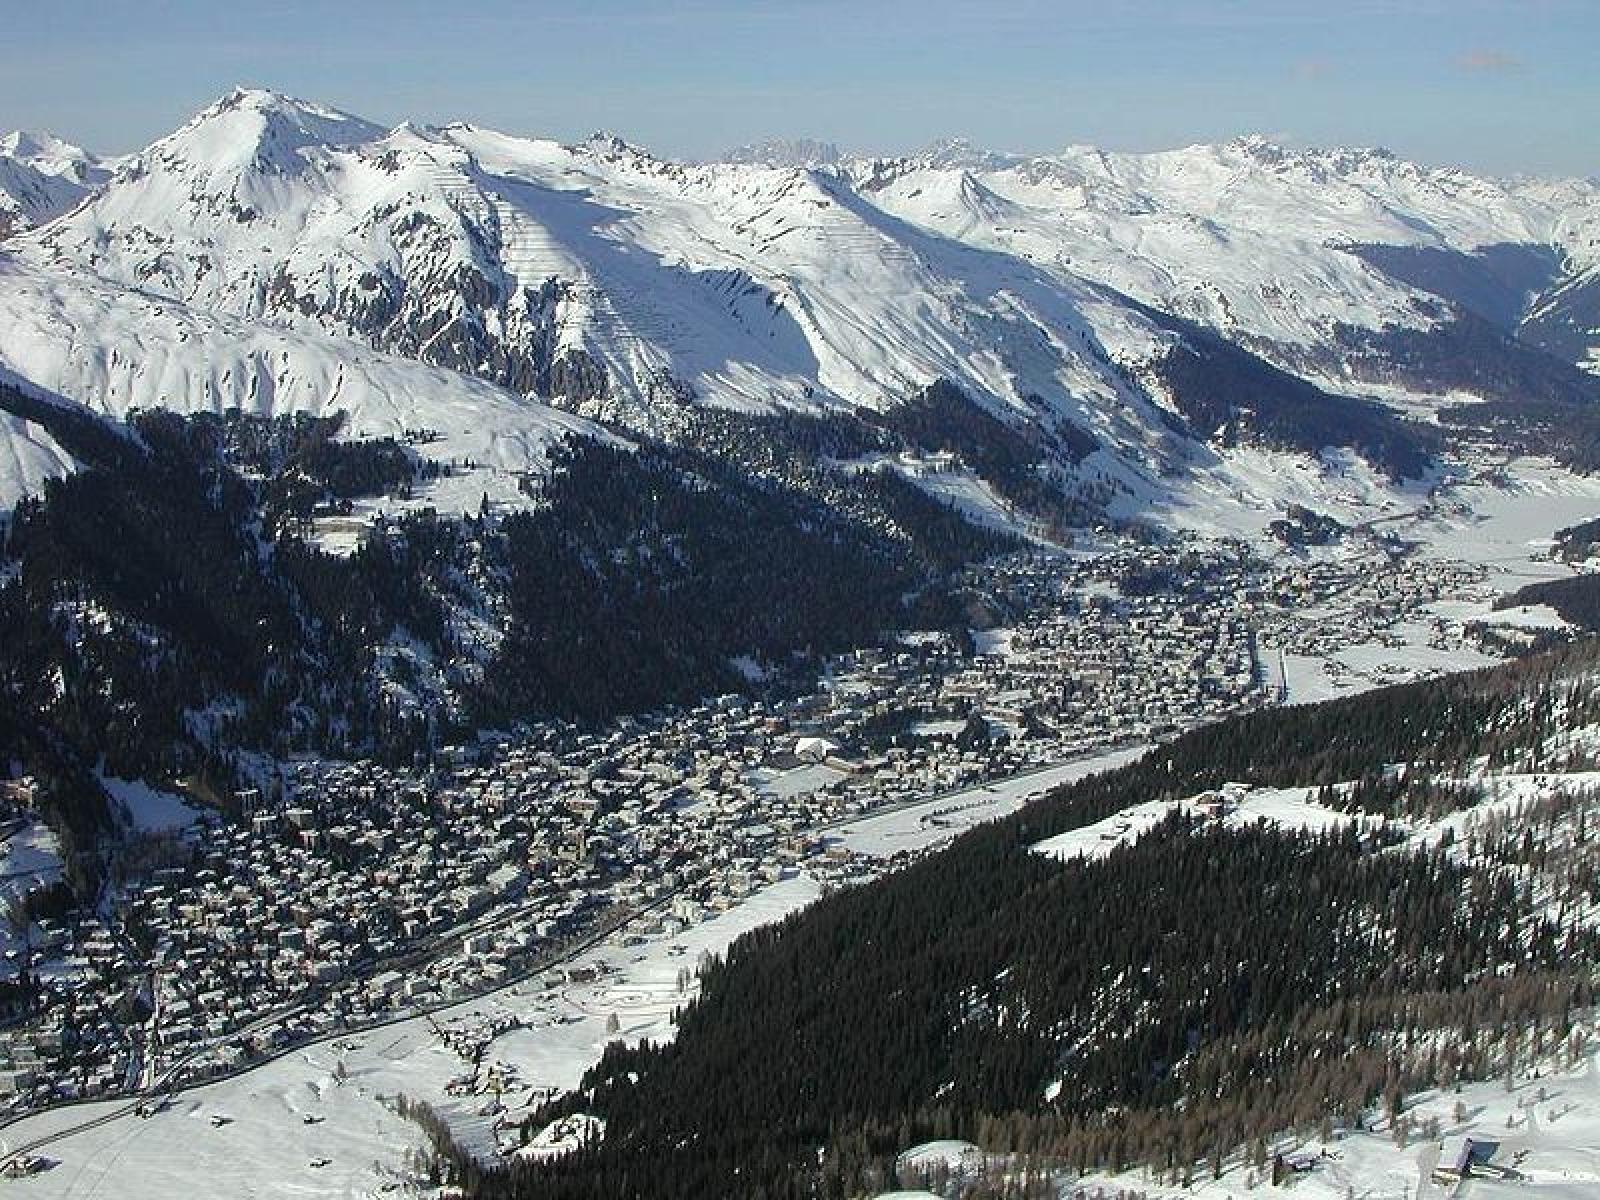
That is why Picarro partnered with the aforementioned organizations, to put our analyzers to the test and analyze and report on greenhouse gas emissions in Davos, Switzerland, where global leaders were converging for the World Economic Forum's (WEF) annual meeting. We wanted to show how valuable continuous emission tracking can be compared to static annual estimates.
The Global Carbon Market: Real Numbers or Imaginary?
Before getting into the nitty grity of the project, it is important to take a step back and consider the global economic driving forces affected directly by greenhouse gas emissions estimates. The global carbon market currently hovers around $150 Billion1 and in 2011, global investment in renewable energy surpassed fossil fuels for the first time2. This year, global investment in green technology is expected to hit a record high of $260 billion3 and growth in the green job sector will be heavily leaned on to help restore jobs to the 205 Billion unemployed globally. These are positive signs that initiatives are being taken to reduce anthropogenic emissions.
But how will we know if all that money and all those programs are actually accomplishing the goal of reduced emissions? How will we have faith in the monetization of these reductions? As legislation to regulate GHG emissions becomes increasingly likely, independent verification of anthropogenic GHG emissions is an emerging need4. In fact, the Bali Action Plan5 identifies the need for Measurable, Reportable, and Verifiable (MRV) mitigation strategies. Increasingly, cities are becoming the area of focus for implementing these strategies.
With urbanization continuing to grow, cities will face some of the biggest challenges in dealing with global climate change, and they also present the biggest opportunity for per capita emission reduction. Over 70% of global CO2 emissions comes from cities, which house more than 50% of the world’s population in only 2% of the world’s land cover6. While many cities have begun to estimate & self-report their emissions using bottom up calculations called Inventories,
“Inventories are records of human activity (fuel sales, road travel) and demographics (housing and business sizes and density, heating and lighting systems) which are assembled to estimate associated emissions of CO2. The data can be quite accurate, but some data are hard to obtain, sources can be missed, and, since assembling such an inventory of activity is time consuming, these assessments are not done frequently (if at all). These accounting efforts are a valuable complement to continuous atmospheric measurements... The atmosphere doesn't lie. Efforts to reduce greenhouse gas emissions require validation. The Atmosphere captures all emissions, and atmospheric measurements provide a unique and powerful means of continuous validation.”
--Ken Davis, professor of meteorology at Penn State University (and collaborator on the Davos project)
Surprising Results
Picarro’s greenhouse gas analyzers, which measure the concentration of carbon monoxide (CO), carbon dioxide (CO2), and methane (CH4) were set up in two key locations. Measurements from the Davos city center show city emission activity while measurements made on a nearby mountain give baseline concentrations. By looking at the difference between the two sites and incorporating the latest in atmospheric modeling from Penn State and CLIMMOD, daily emissions patterns and trends were quantified and reported daily at http://citycarbon.picarro.com.
Results found by the team in Davos were surprising. Common sense would tell you when 3,000+ people travel to a town inhabited by just over 12,000 to engage in a flurry of meetings and events, emissions are bound to increase. In fact, exactly the opposite occurred. During the month leading up to the meeting, daily average emissions from the city were found to be 35% above inventory numbers, but during the conference, emissions dropped unexpectedly by 40%. Since the meeting’s conclusion on January 29th, daily emissions have climbed to 40% above pre-meeting levels.
The increase in emissions post-WEF is correlated with extremely low temperatures, presumably causing an increase in home heating. Temperatures during WEF, however, were near average for the period and fail to explain the drop in emissions. This leaves changes in traffic, or a reduction in individual home heating due to residents leaving during the meeting, as two possible explanations. Locals in Davos did comment that many people leave during the WEF annual meeting, but it is unknown how many may have done so. Davos, a small ski village in the Swiss Alps, is certainly less complex than mega-cities such as Tokyo or LA, and yet, even here, inventories and common sense clearly are not adequate tools for assessing carbon emission profiles. Measurements in Davos will continue through the end of February and the full results will be written up & submitted for publication by the Penn State team.
The city carbon project was a truly collaborative effort executed by Picarro, in partnership with: Ken Davis, Scott Richardson, Natasha Miles, and Thomas Lauvaux, at Penn State University; NOAA scientist Colm Sweeney; fellow instrument company Sigma Space; and collaborators on the ground in Davos from the Agency of Nature and Environment (ANU) and the Institute for Snow and Avalanche Research (SLF).
The Penn State group is pushing the envelope of this rapidly developing field of research, and was able to draw from their experiences with the closely related Indianapolis Flux Experiment (INFLUX). INFLUX, primarily supported by National Institute for Standards and Technology (NIST), is a partnership of a number of institutions with the goal of testing the ability to use atmospheric inversions to measure the emissions of CO2 and CH4 from the city at the kilometer spatial scale over several years. This is the most densely instrumented urban emissions experiment yet to be deployed, and should set a standard for future use of atmospheric inversions as a tool to measure city-scale greenhouse gas emissions. More Information on Ken’s group and all partners can be found at: Davos City Carbon partners.
Details of the data analysis can be found and downloaded from the citycabon website, and commentary from Ken Davis can be found on the picarro blog.
Major press coverage of the citycarbon project
Measuring the Hot Air in Davos, Bloomberg
Sources for this Blog
1 http://siteresources.worldbank.org/INTCARBONFINANCE/Resources/StateAndTrend_LowRes.pdf
2 http://thinkprogress.org/romm/2012/01/22/408784/wired-clean-energy-experts-debunk-solar-wind/?mobile=nc
3 http://www.earthtechling.com/2012/01/2012-to-be-a-record-year-for-clean-tech-investment/
4 Pacala et al., 2010
5 13th Conference of the Parties of the UNFCCC - COP 13, 2007
6 http://www.bbc.co.uk/news/science-environment-12881779