Link to CityCarbon website showing current emissions in Davos
(hover over graph to the right for explanation)
02 February, 2012 Summary of Results
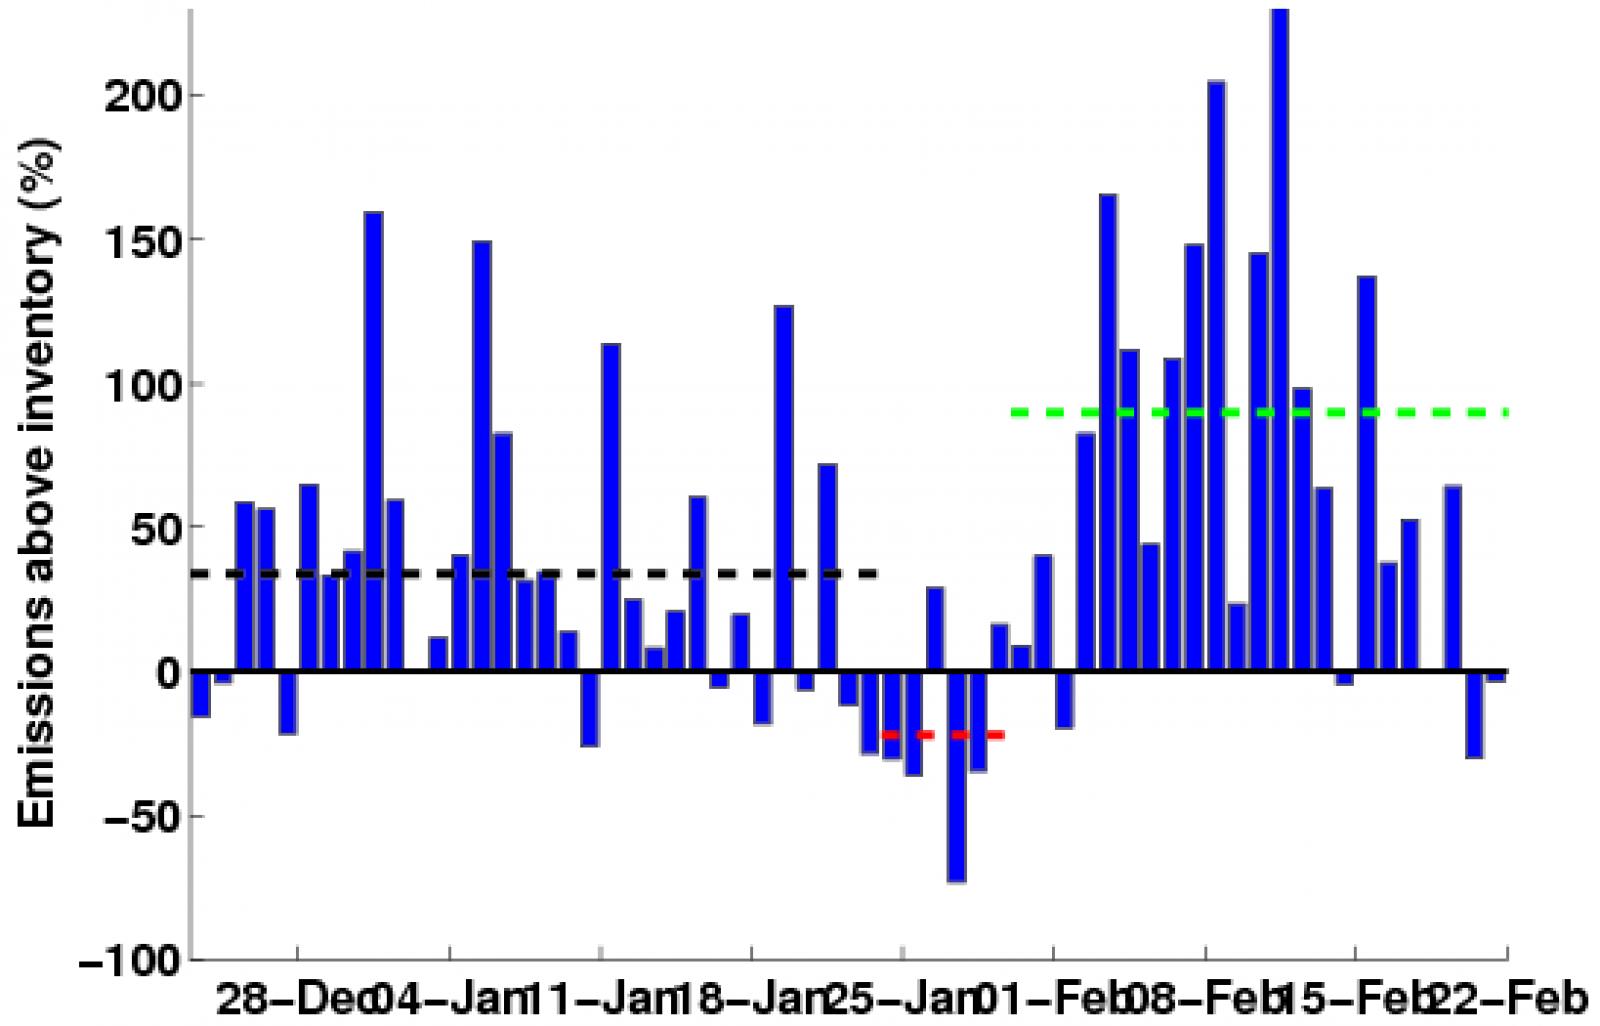
By combining concentration data from Picarro instruments with atmospheric modeling by Penn State and Climmod, we have measured greenhouse gas emissions in Davos before, during and after the World Economic Forum (WEF) annual meeting. While inventory-based emissions estimates are reported at best annually, we provide emissions estimates on a daily basis. Prior to WEF, the average emissions are 35% above the inventory annual value. This was not too surprising, given the expectation of emissions caused by heating in the winter. During WEF, however, the emissions decreased to 40% below the pre-WEF average. Although we expected this was due warmer weather causing a reduction in home heating, overall air temperature during WEF was not out of the ordinary compared to the pre-WEF temperatures. This leaves changes in traffic, or a reduction in individual home heating due to residents leaving during the meeting, as two possible explanations. Following WEF, we expect the emissions to increase back to their pre-WEF values. In fact, average emissions have already climbed to just 10% below the pre-WEF average. We plan to continue measuring the air in Davos for another month to determine if this trend continues.
30 January, 2012
Slightly higher emissions reported on the last day of the WEF. We are still learning about the nature of this estimate, but we are pretty sure that emissions don't fluctuate from day to day as much as our estimates do. There is probably some unresolved source of this variation which shouldn't be taken too seriously. We have more faith in the average over a few days. With 29 Jan emissions accounted for, CO2 emissions during the WEF appear to have dropped to a level that is 40% lower than our month of observations during the WEF.
An interesting note...the emissions actually first dropped (see caveats above about not trusting the daily values too much) on 22 January, two days before the WEF started.
What's next? This is a neat demonstration. We will keep the system running for about another month to see what happens after the WEF. We are also running a long-term, densely instrumented experiment in Indianapolis, Indiana, USA. Look for results from that experiment for progress on just how precisely one can derive fluxes using this approach. For more information see http://influx.psu.edu.
29 January, 2012
28 January provided yet another day of relatively low emissions estimates. And there were some winds, so our "well mixed" criteria were met. This is not just a coincidence. Contrary to our expectations, there is a persistent signal of lower CO2 emissions from the valley during the week of the WEF.
Two other interesting things have happened in the data record in the past couple of days. One, the del-CH4/del-CO2 ratio has been relatively high. What is that? We are measuring CH4 in and above the valley as well. There is also a signal of consistent methane emissions from the valley. We haven't yet computed an emissions estimate, but that will be easy to do using the same methodology as we have used for CO2. The unique thing that emerged in the past couple of days is that the CH4 enhancement in the valley (del-CH4 = CH4 valley - CH4 mountainside) is relatively large compared to the CO2 enhancement in the valley (del-CO2 = CO2 valley - CO2 mountain). This suggests that the atmosphere is, for some reason, sampling a source of CH4 that is not correlated with CO2 emissions. This ratio has gone up from time to time in the past month, but this event was the strongest yet in the record.
The other interesting event was that, for the first time since we started collecting data, the mountainside site appears to have gotten a very strong whiff of air from the valley. You can see on the citycarbon.picarro.com web site where the normally flat red line showing mountaintop CO2 briefly jumps up to nearly match the blue, valley air CO2 concentration. This is the strongest mixing of air up the mountainside that we have observed to date.
Today is the last day of the WEF. Once the participants leave town, we'll keep measurements running for a while to see if emissions return to pre-meeting levels. I really don't know what to expect.
Sigma Space, Inc., is also beginning to gather a record of backscatter lidar observations from the valley. We hope to be able to test our simulations of ABL depth vs. these observations to test for potential bias in our emissions estimates. These data have yet to be integrated into our observing system.
28 January, 2012
27 January, 2012
A revision, and some interesting findings!
Frustrated with the lack of ability to estimate emissions with our relatively strict screening of data for well-mixed conditions, and anxious to see if we can detect any changes in emissions caused by the WEF, we loosened the bounds for what we considered "acceptable" data. We also tried constricting those bounds. What emerged was interesting and encouraging. First, the general pattern of emissions vs. time that we computed didn't change significantly as we altered the boundaries on what we considered to be acceptable data. This is very encouraging, and means that we believe that the pattern of emissions vs. time that we have measured is fairly robust. This change in the concentration data that we retained for our calculation explains our revision of the "pre-WEF" emissions estimate.
Second, by loosening the bounds of "acceptable" (basically, well-mixed enough), we found that every day of the WEF demonstrated a significant drop in emissions relative to the month prior to the WEF. That was a real surprise, but the signal in the data looks real.
Given that we have a pretty cool and interesting set of results, a natural follow up question is, what are the major sources of uncertainty? Just how robust are these findings. Quantifying uncertainty is harder than quantifying an emissions rate, but here is an insight into what we think are the primary sources of uncertainty in these results. When possible, we'll assign some values to these uncertainties.
First, the "pre-WEF" average emissions that we computed varied by roughly 30 tons C per day depending on our data threshold. This is one measure of uncertainty in our findings.
Second, it is entirely possible that our emissions estimate is suffering from a systematic bias. By a systematic bias we mean an error that would change the emissions estimate, but all in the same direction. The simplest example is an error in our simulation of the depth of mixing of air over the city. If we are off by 30% in that value (which is possible), then our emissions estimates are similar off by 30%. This would yield a change in the total emissions, but would not influence the change in emissions over time that we have detected. No meteorological transport model is perfect, so there will be some degree of bias associated with atmospheric transport...the question is how large, and what sign. Lidar and local meteorological data can help us to improve our confidence. This sort of systematic error can be tracked down and minimized.
Finally, the results show more day to day variability than we think can be reasonably attributed to changes in emissions. Geophysical measurements often suffer from fluctuations which we'll label as "noise." Day to day variability has been quite large, with a standard deviation (not standard error, for the technically inclined) of about 100 tons C / day pre-WEF. (If this is truly independent random error, that would translate to a standard error of 20 tons C / day pre-WEF given 30 days of sampling.) The "during WEF" value is only based on three days of data. It is possible - though we think not likely - that we just got "unlucky" and we'll see the next days switch back to values similar to the pre-WEF results. Nevertheless, we are fairly confident that we have truly detected a drop in emissions during the meeting.
What is the "take home message?" The emissions from this small mountain village make up a very small percentage of global emissions - the rate of emission we measured from Davos and the WEF isn't the main point. The take home messages are two: First this experiment demonstrates the capability of using atmospheric measurements to quantify urban emissions. That is important to do, and to do with good accuracy and precision, because we need to quantify GHG emissions and multiple means of measuring emissions (e.g. a combination of ground-based, bottom up estimates and atmospheric measurements) is going to increase our confidence that we know the true emission rates. Second, this experiment shows that with measurements like this, we can begin to understand urban "metabolism." We really didn't expect emissions to drop during the WEF. By measuring the emissions, we discovered something, and now we can ask "why," and being to understand better what factors are really driving these emission rates. This will be critical if cities are going to pursue GHG reduction efforts. It will be important to be able to measure, directly and with confidence, the impact of these measures.
Thursday 26 January, 2012
Unfortunately, yesterday was too calm (in terms of atmospheric turbulence, not economic discussions) for us to be confident enough to compute the day's CO2 emissions from Davos. The limit is certainly not the Picarro sensors. In fact, these conditions are ideal for very large increases in CO2 concentrations in the valley. You can see the concentration climbing on the time series on the CityCarbon web site. The limit is this case is our confidence in our ability to simulate atmospheric mixing in calm conditions. When the mixing is weak, very small errors in atmospheric turbulence and mixing can cause very large changes in the CO2 mixing ratio close to the earth's surface. Our method, as currently implemented, would interpret any discrepancies between observed and simulated CO2 as caused by incorrect estimates of emissions from Davos when in fact the cause might be incorrect simulation of turbulence. This is a classic example of "transport uncertainty." Our approach is only as accurate as our ability to simulate atmospheric mixing. This is an issue with any atmospheric budget, or atmospheric inversion approach to this problem.
Are there any ways around such a problem? Yes. One approach is to improve our ability to simulate the very stable atmospheric boundary layer. This is a tough problem, but boundary layer meteorologists like tough problems. Another approach, however, is to observe the CO2 concentration in the volume of air above a city, not just on a tower close to the surface. In this demonstration we are using one measurement close to the ground to represent a "well mixed" atmosphere. If instead we had measurements throughout the lowest, say, 200 or 300 meters of the atmosphere over Davos (imagine a tall tower? A tram up and down the mountain side? A balloon?) then we could directly measure the entire amount of CO2 accumulated in the air above the city, and we could abandon the need to sample only "well mixed" atmospheric conditions. This sort of approach would allow us to estimate CO2 fluxes in a broader range of atmospheric conditions, and increase our confidence in these emissions estimates.
Wednesday 25 January, 2012
Surprisingly, our estimate for the first day of the WEF showed a drop in CO2 emissions from the valley relative to our estimates for the month prior to the meeting. Our "man on the ground" in Davos (none other than Picarro CEO Mike Woelk) notes that he has been told that the locals leave during the WEF, and that he observes that traffic is very light. Maybe emissions really did drop with the onset of the WEF?? Stay tuned. We'll do our best to sort this out from "the top down" - using the atmospheric budget system we have developed for this increasingly interesting demonstration.
This is a good time to remember that this in an experiment! It is one thing to measure continuously the CO2, CO and CH4 concentrations with great precision and accuracy within and above a beautiful mountain valley - which is what the Picarro sensors deployed at Davos are doing - but the methods for inferring emissions from those measurements are still a work in progress. Our simulations of meteorological conditions (wind speed or boundary layer depth) for yesterday might have been in error, for example. Nevertheless, it is also quite possible that due to warm conditions and other factors, that emissions from Davos on 24 January were truly significantly lower than on most of the days in the past month. We need to see how the next few days look to find out what is really going on. Doing an experiment online in near real time is a new experience.
I am fairly confident of our conclusion that the emissions from the valley prior to the meeting were, on average, significantly higher than our first guess which came from an annual inventory published in 2008. We will need to evaluate how well the Weather Research and Forecast model (WRF) was simulating atmospheric conditions in the valley to be more certain, but first indications are promising.
It is remarkable that this relatively windy period has kept the CO2 accumulation in the valley atmosphere considerably lower than the past month. Peak mixing ratios are no more than about 450 ppm. Earlier in the month mixing ratios at night in the valley were nearly 650 ppm! We don't use those measurement to estimate emissions, however, since it is difficult to simulate the shallow, highly stratified nocturnal boundary layer. We only estimate emissions when the atmosphere is relatively "well mixed" by turbulence. The primary source of turbulence in this setting is wind shear. When winds blow over the surface, eddies are created by buildings and trees and the like. These eddies stir up the air over the city. In many environments the sunlight would cause convective mixing, but the snow cover over Davos is preventing much solar heating of the surface from occurring - at least according to our turbulence measurements deployed alongside the Picarro analyzers.
Tuesday 24 January, 2012
No increase in emissions from Davos, Switzerland as a result of the World Economic Forum is evident yet. In fact, emissions of CO2 in the past couple of days appear lower than most of the previous month. Our best guess is that this is due to the relatively warm temperatures in the recent days. The maximum temperature at our observing station in the valley approached 10 degrees Celcius recently, the warmest since the instruments were deployed just before Christmas. We're hypothesizing that, since a lot of the energy use in the valley is fuel consumption from heating, that the emissions should be anti-correlated with temperature. Our measurements tentatively confirm that hypothesis*. But we don't live there! Could any Davos residents help us? Are you burning more fuel for heating on those colder days? And how is the traffic?
-Ken Davis, Professor Meteorology at Penn State University