Dr. Ira Leifer, Marine Sciences Institute, UC Santa Barbara
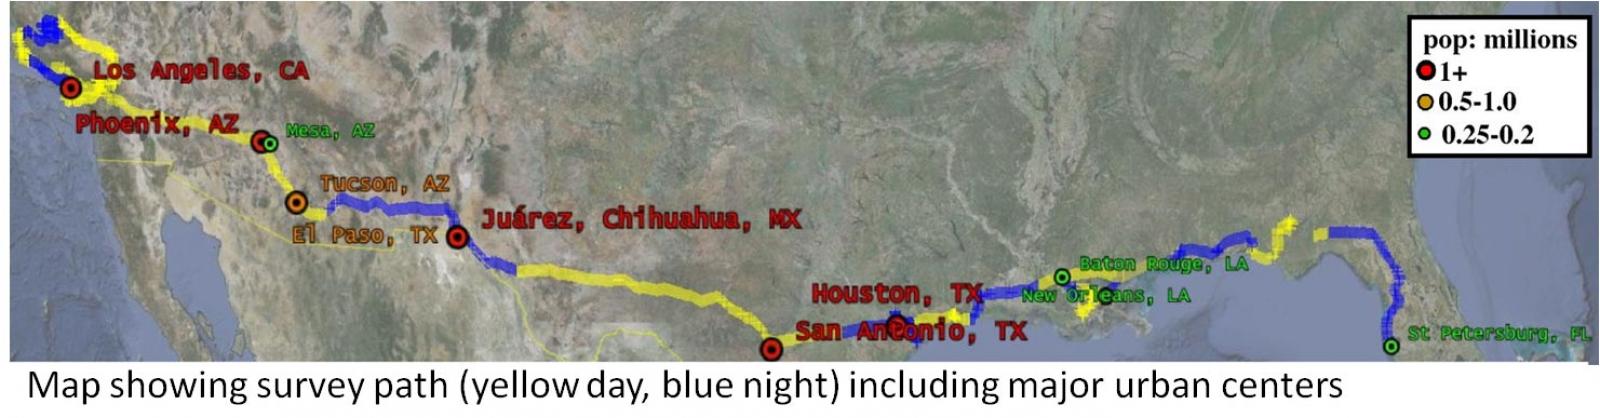
SANTA BARBARA, CA — UC Santa Barbara scientists, Dr. Ira Leifer, Paige Farrell and Dan Culling recently completed a methane measurement transect of the southern US while en-route to deliver their Picarro flux analyzer to a waiting ship in Louisiana. The Picarro analyzer and other equipment was originally intended only for shipboard measurements, but Dr. Leifer calculated, that for the cost of shipping and airfare to the port, they could drive the instrument instead, and use the opportunity to gather long-distance mobile methane data. The team went for it, rented an RV, rigged up the instruments, and drove nearly non-stop for two weeks on a trek that took them from Santa Barbara, California to Cocodrie, Louisiana and St. Petersburg, Florida, before returning to southern California. While mobile measurements are becoming increasingly popular, this group is the first we’ve heard of that have added an on-board living component for maximizing mobile terrestrial measurements.
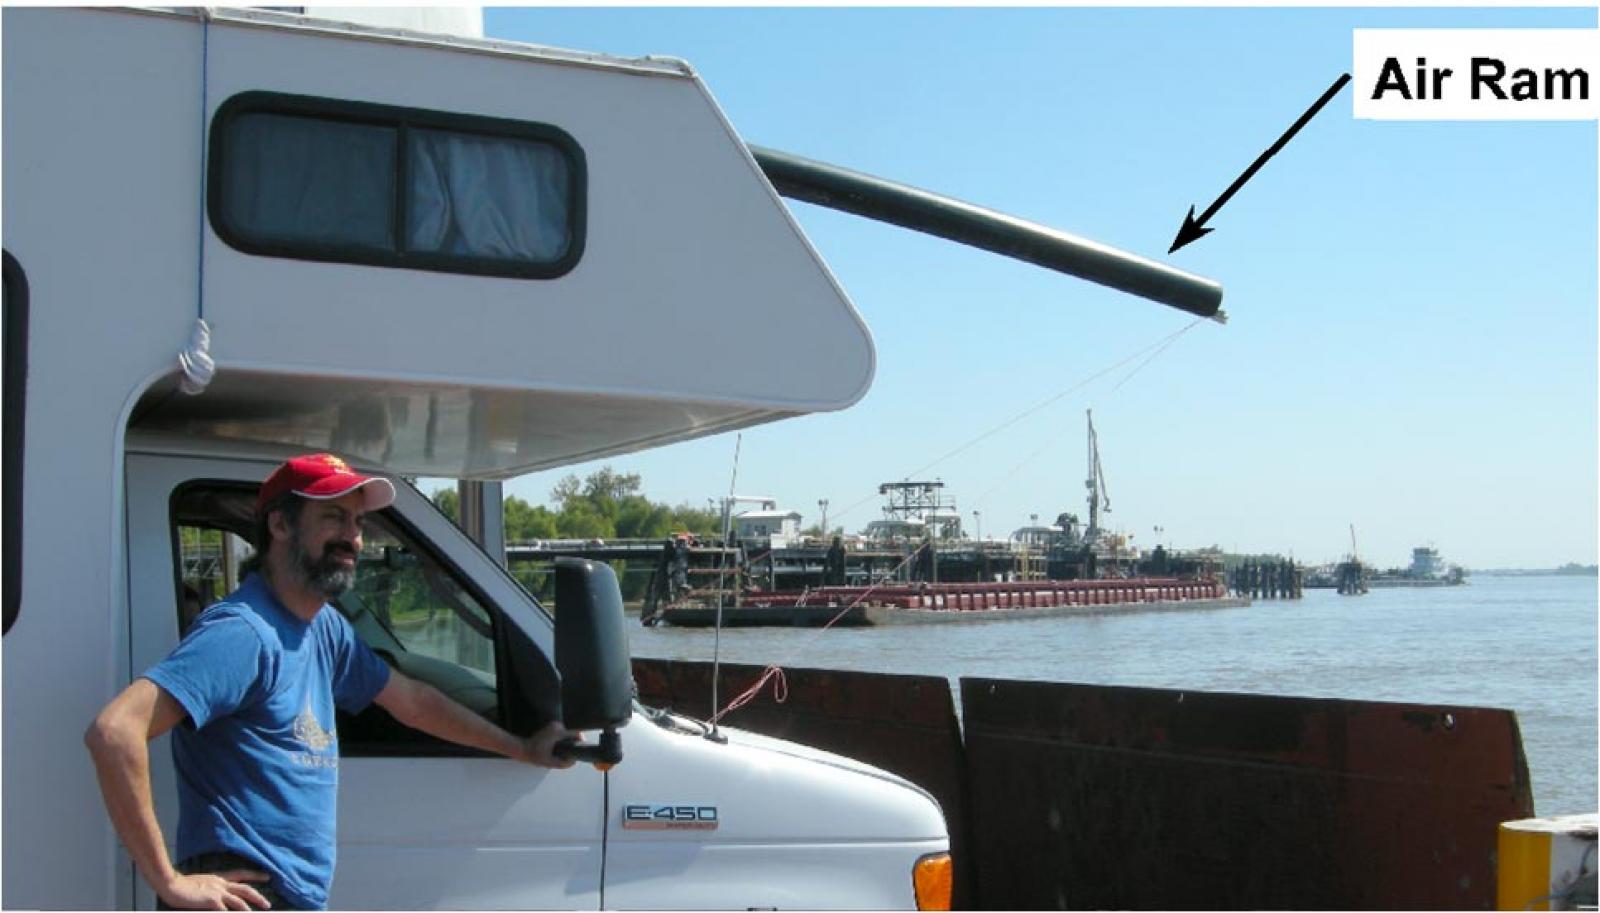
The team loaded the RV with a gas chromatograph (GC), GPS, power conditioner, several portable computers with cell-phone modem, a Picarro flux analyzer, and a custom-made, 30 foot air sampling intake called the ‘air ram’ made out of 4” ABS pipe that projected an extra 10 feet in front of the RV. The biggest challenge for the team was to isolate ground and wall vibrations from the GC. To do this, the group converted the queen sleeper area into a makeshift analytic chemistry lab complete with gas bottles and vacuum pumps in the closet. After a lot of trial and error, the team was able to achieve vibrational isolation through a combination of a half-inflated queen size air mattress, doubled-over tarps stuffed with Styrofoam packing peanuts, and plywood with Dr. Scholl-like gel mounts under the GC legs. To complete the task, the team bound it all together using bungee cords and rope.
Once they were up and running, the team was able to get methane measurement every 50 seconds from the GC, while the Picarro recorded methane, carbon dioxide and water vapor data at 2 Hz. The measurement approach used was to first identify points of interest (methane hot spots) based on methane signatures from the instruments as well as visual identification of geologic or man-made features. Then, using local wind and meteorology data retrieved from the online site www.weatherunderground.com, they drove in the direction of increasing methane concentration until they were able to locate and verify the source.
As they traveled, the group was able to refine their methods and quickly adapt to the changing conditions. For example: They found cars to be a persistent source of methane, which caused them to shift their calibration schedule so measurements could be made at night when there was less traffic. Daniel also noted the Picarro’s simultaneous CO2 measurements played an important role in identifying when vehicular exhaust contaminated the incoming air samples, which usually lead to route changes. Similarly, while attempting to make background measurements in the Mojave Desert, they found the background repeatedly interrupted by emissions coming from even the smallest of towns containing no more than 10 houses.
Unencumbered by the need to stop frequently for food, bathroom or lodging, the RV enabled nearly continuous measurements over the 11 day trek. In fact, the measurements were usually only stopped for calibrations, gas bottle refills, or to fix instrumentation issues. A prolonged delay was avoided when group was faced with empty gas bottles in a remote area. The Louisiana branch of Airgas came to the rescue by rerouting a shipment of calibration gas bound for California so the team could continue making measurements. Over the course of the trip, the scientists logged over 6,000 GC measurements and more than 40 hours of 2 Hz Picarro data in Southern California alone. However, it wasn’t just the amount of data collected that made the trip so worthwhile. The data set covers a diverse array of methane sources including predictable, man-made sources such as refineries and cities, as well as natural sources such as wetlands.
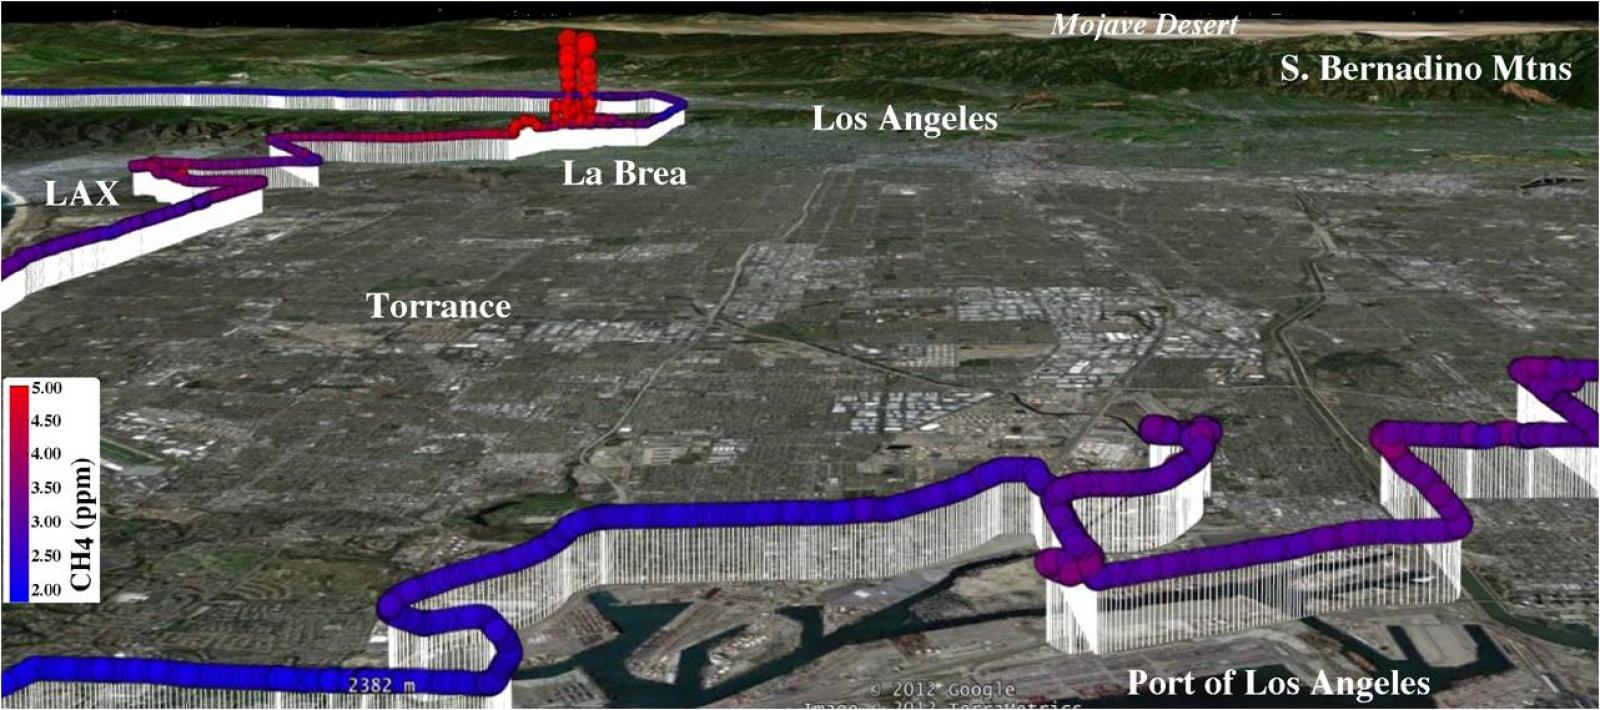
Surprisingly, the largest source measured on the trip was natural. The team traveled to the La Brea tar pits expecting a significant methane signal, however, the magnitude of geological methane emissions escaping from the tar pits and surrounding area were much larger than expected. According to the data collected, this may be as much as a quarter of the entire LA County inventory. Other reported measurement gems include: A vertical atmospheric profiles of the LA basin obtained while driving up and over the San Bernardino mountains; and a nearby extensive brushfire in Louisiana, where they were able to take advantage of the opportunity by making 3 passes through the plume to estimate its emission strength.
Says Dr. Leifer about the experience “When most people take a road trip they go to national parks, but instead, we took a trip through the industrial belly of the US, and it was beautiful too. We had to be alert and pay much closer attention to details of the terrain, winds, and events than you typically would on a road trip, and by doing so, we gained completely new perspectives on something most people normally just don’t think about.”
The team has submitted part one of their work to Atmospheric Environments for publication and will compare & link their findings with satellite data (SCIAMACHY and GOSAT) for part two, which they plan to submit eminently. The trip was so successful, the team is already planning a summer campaign to the MacKenzie delta in the Canadian Arctic and potentially another North American continental transect in the fall.