One of our most popular pairings for a fully integrated soil flux measurement solution are Picarro’s G2000 series analyzers with Eosense’s eosAC Flux Chamber and eosMX Multiplexer. In this application, we see how our G2508 greenhouse gas analyzer is used with Eosense’s automated chambers and multiplexer along with a modified, insulated enclosure for continuous measurements in periodically inundated fields. We’d like to thank Dr. Whendee L. Silver, Ph.D. candidate Tyler L. Anthony, and the Ecosystem Science Division team at University of California, Berkeley, USA for their contributions in this deployment. Enjoy!
Flood-irrigated agricultural soils can be a significant source of the greenhouse gases (GHG) carbon dioxide (CO2), methane (CH4), and nitrous oxide (N2O) (Linquist et al. 2011, Oertel et al. 2016). As these ecosystems are typically characterized by high spatial and temporal heterogeneity, continuous trace gas measurements are needed to better detect patterns and quantify net ecosystem fluxes. Measuring surface fluxes is challenging during periods of inundation, but exclusion of these periods is likely to significantly underestimate annual CH4 emissions, and potentially overestimate N2O effluxes. Here we report on modifications to a system of Eosense eosAC automated chambers, a Picarro G2508 greenhouse gas analyzer, and a modified insulated enclosure (Bonar Plastics) for continuous measurements in periodically inundated fields.
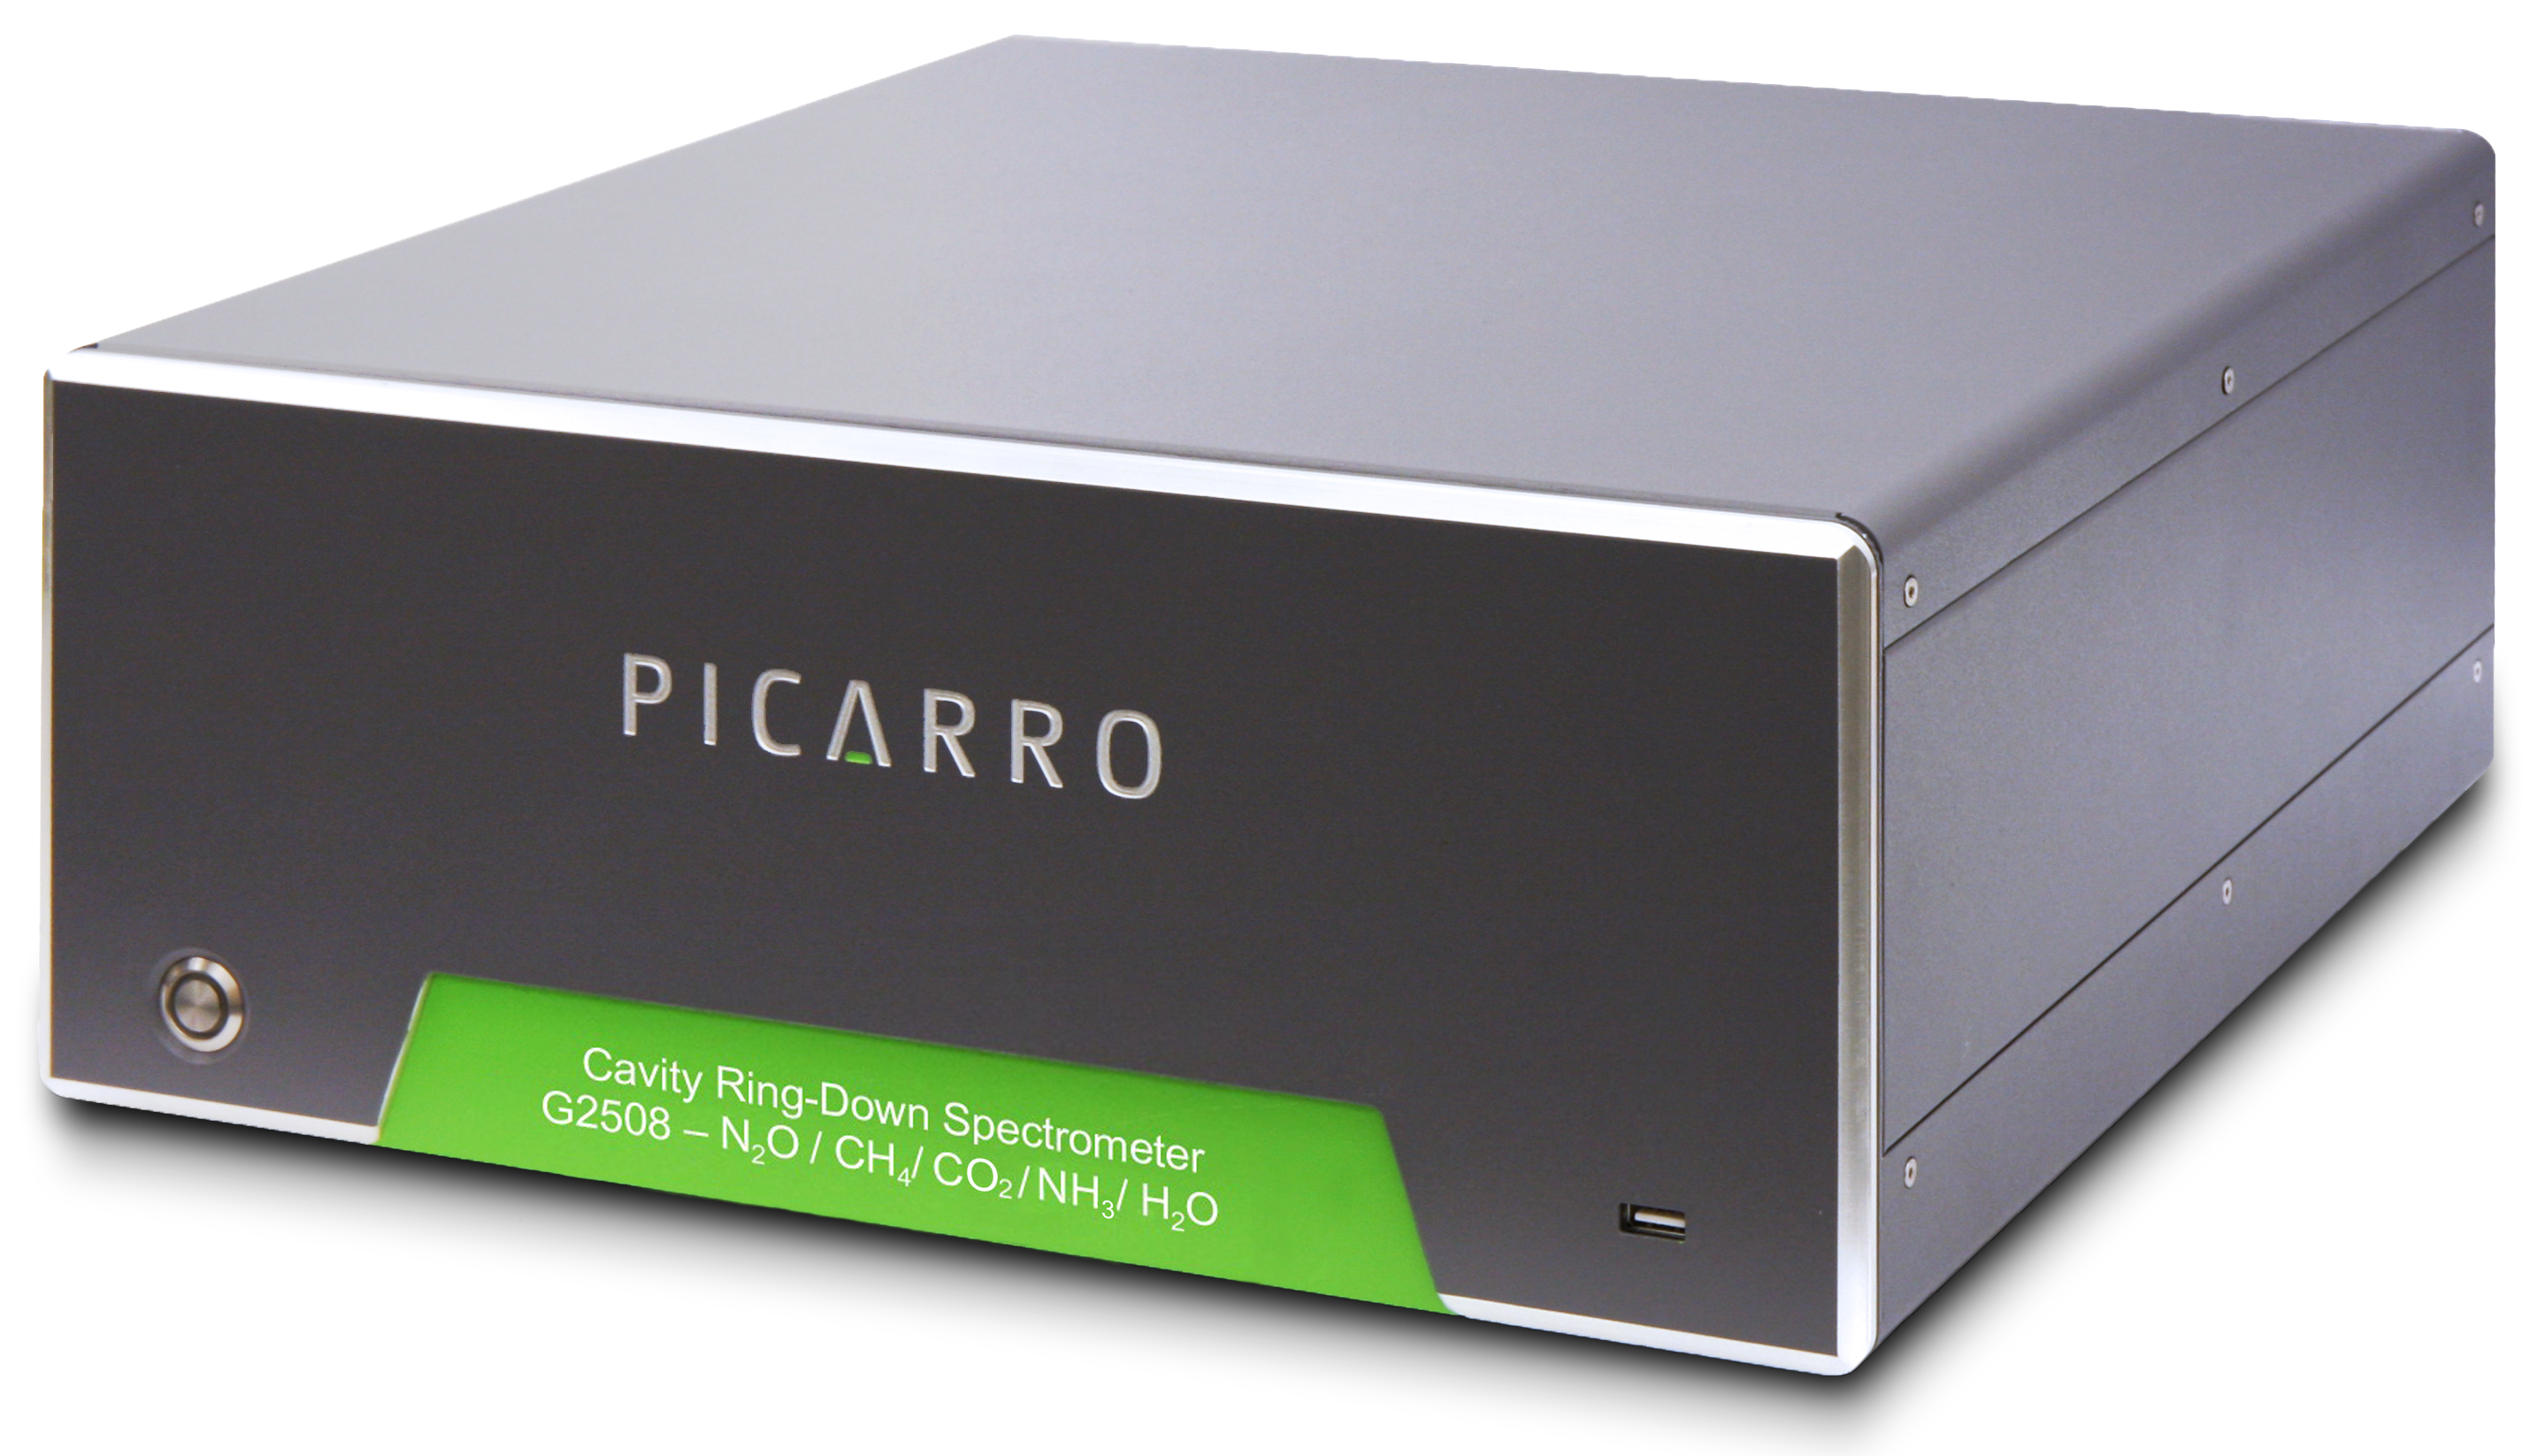
The Picarro G2508 Gas Concentration Analyzer.
System Modification and Maintenance
We deployed three trace gas analysis systems, consisting of nine chambers, deployed 5 m apart in a 15 by 15 m grid. For continuous field deployment in periodically inundated systems, there were two major modifications deployed. The first change included the use of two sets of extended chamber collars to ensure the eosAC chambers were always above the water table. The second modification was the creation of a weatherproof, insulated enclosure, in this case retrofitting a Bonar Plastics insulated fishing box. Note that access to line power greatly facilitated continuous measurements given the energy use required to maintain an air conditioner (500 W), Picarro G2508 gas analyzer and recirculation pump (~200 W), and Eosense eosAC/eosMX chamber and multiplexer system (~100 W). For a thorough description of the eosAC/eosMX and Picarro G2508 setup, please refer to Picarro application note AN0003 (Eosense n.d.).
Modification of the eosAC Chamber Collars
The fields in this study experience two types of flooding events throughout the year. They receive periodic flood irrigation events during the growing season, where the water table is maintained 10 cm above the soil surface for >24 hours. During the fallow season, these fields are continuously flooded for approximately three months to minimize weed growth and provide habitat for migrating waterfowl. This fallow season flooding occurs with a maximum water table height of 30 cm. Given the large difference in the level of flooding during the year, chamber collars with different heights were needed for each season.
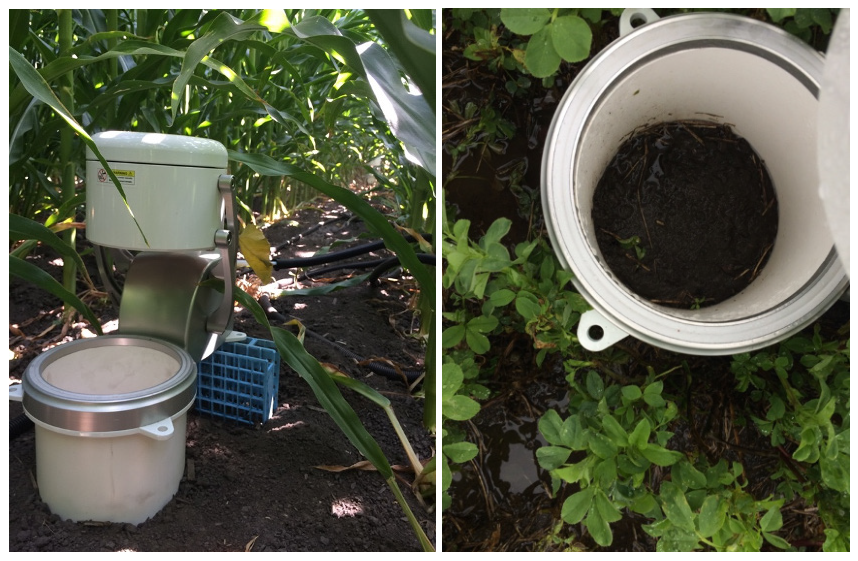
Figure 1. eosAC chamber field-deployed with a modified 15 cm collar (left), and an example of similar soil moisture inside and outside of collar (right).
For the flood irrigation events, 15 cm collars were cut from sections of 6-inch diameter schedule 40 PVC pipe, the size necessary to fit appropriately with the eosAC chambers. Six 10 mm holes were also drilled 2 cm from the lip of these collars to ensure adequate liquid exchange between topsoil inside and outside of the soil collar. Soil collars were installed approximately 3 to 4 cm into the soil surface to ensure proper coverage of the drilled holes. We inserted a small metal support of the same height as the collars at the base of the chamber to provide greater stability (Figure 1). For this study, test tube racks worked well. For the longer fallow periods, similar 35 cm collars were created out of 6-inch diameter schedule 40 PVC pipe, and conventional milk crates were used to provide extra support to the chamber base (Figure 2). Both sets of these collars remained installed in their original positions throughout the field campaigns, except during field management activities (plowing, seeding, etc) or when switching collars for maintenance.
To determine chamber volume, chamber collar heights were measured weekly and interpolated between measurements to account for differences in soil and water table height over time. These values were also used to calculate the minimum detectable flux of N2O (Nickerson 2016), which was 0.22 μmol N2O m−2 h−1 for 15 cm collars, and 0.33 μmol N2O m−2 h−1 for 30 cm collars, roughly two orders of magnitude lower than the average fluxes measured with these two collar heights. The minimum detectable N2O fluxes reported here are conservative estimates, as the actual chamber volume was always smaller than the maximum theoretical volume used to calculate the values above.
Fluxes of CO2, N2O, and CH4 were calculated using Eosense eosAnalyze-AC v. 3.7.7 software. For more details, refer to the eosAC user manual (Eosense 2016). Data were then exported via .csv files and data filtering was performed in R (R v.3.2.2) (O’Connell et al. 2018). Fluxes were removed from the final dataset if they were associated with anomalous temperature, moisture, or pressure readings (all sampled separately); if the initial concentrations of CO2, N2O, or CH4 were negative or significantly different than ambient values; or if the chamber deployment period was less than 9 min or more than 11 min. Dependent on the study site, this removed 1−10% of individual flux measurements (number of individual flux measurements greater than 20,000 at all sites).
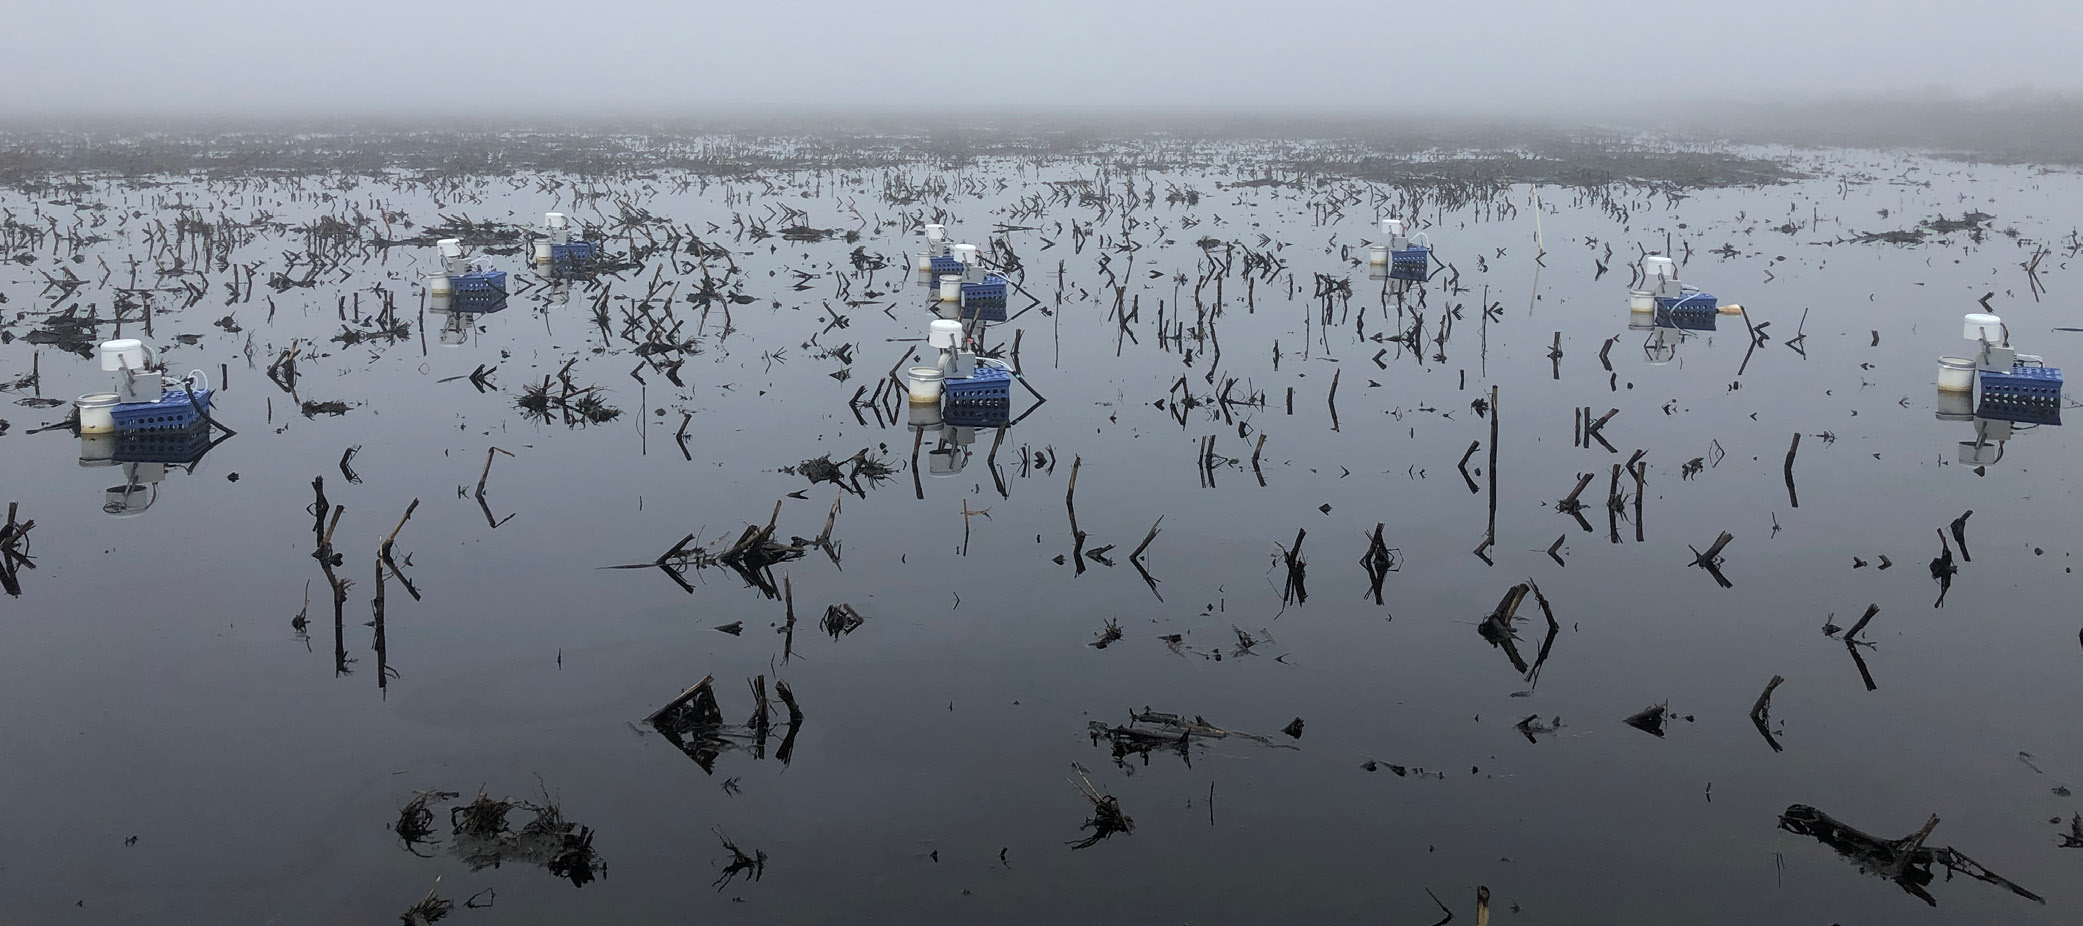
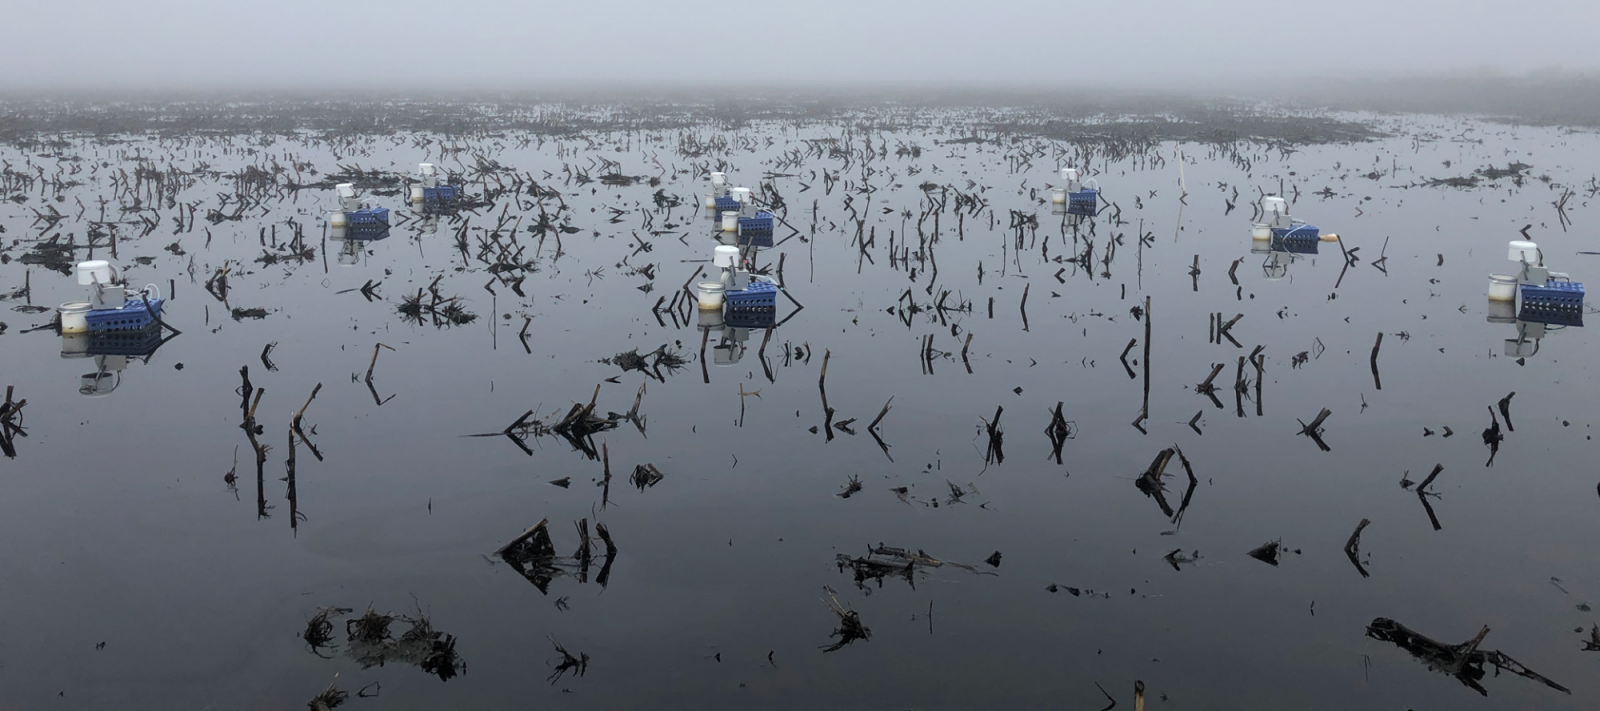
Figure 2. Chambers installed with 30 cm collars during fallow season flooding event
Creating a Weatherproof, Insulated Enclosure
To create a weatherproof and insulated enclosure with an optimal operating temperature for the Picarro G2508, we utilized a 21 cubic foot HDPE Polar Blue fish bin (Bonar Plastics) with a few modifications (Figure 3). An air conditioner was needed to maintain an internal box temperature of ~27°C. We installed a Whirlpool WHAW050BW (or equivalent) air conditioner by first sawing a 40 cm by 35 cm square hole out of the longest wall (Figure 4). The air conditioner was then mounted using its accompanying brackets, and the remaining holes were sealed with foam insulation. To weatherproof the top of the enclosure, extra-large window seal was installed around the edge of the lid and the edge of the box. Gate latches and padlocks were also installed as security measures to protect the instrumentation from theft.
The drain hole supplied with the bin happened to be the ideal size for all accompanying tubing and cable needed to power the instrumentation; no modifications were necessary. If more cable is needed, the accompanying plug mount (pictured as a white circle in Figure 3 inset) can also be cut out with a power drill and hole saw. Holes were sealed with either electrical putty or foam sealant.
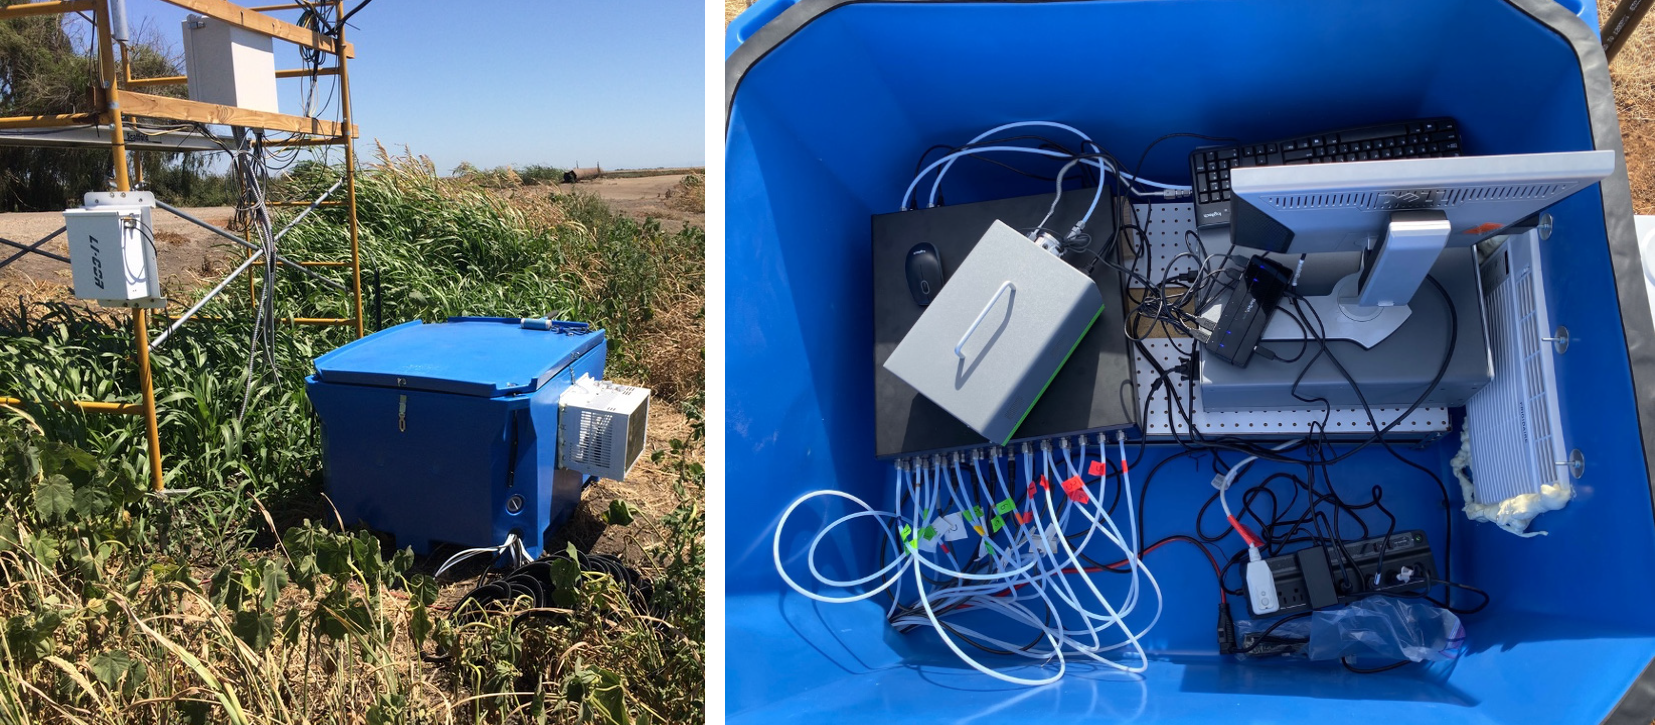
Figure 3. Modified Bonar Plastics Polar Fish bin deployed in the field. (Left) Figure 4. Enclosure interior after installation of Picarro G2508 and Eosense eosMX. (Right)
We utilized a number of techniques to minimize the chances of water reaching the Picarro G2508. A main water trap with a ceramic condensing element (Parker A914-BX, not evaluated by Picarro) was installed between the eosMX multiplexer and the G2508 inlet port. This is meant to condense excess H2O in overly humidified air and as a final measure along the line to protect the G2508. We also maintained an elevated temperature during wet, cold winter months, and left as much sample tubing as possible within the insulated box. This helped to raise the temperature of the air being sampled before it came in contact with metal internal components of the eosMX. The eosMX was installed horizontally to minimize chances for condensed water to run from the eosMX outlet port to the G2508 inlet port.
To further minimize the potential for water damage, we used an air compressor (Husky Tools) fitted with a 5/16 inch SwagelokTM union to flush liquid water from the gas sampling lines weekly during the winter and spring wet seasons. Both inlet and outlet tubes for each chamber were attached to the air compressor, and 30 psi of compressed air was run through each line for at least 15 seconds.
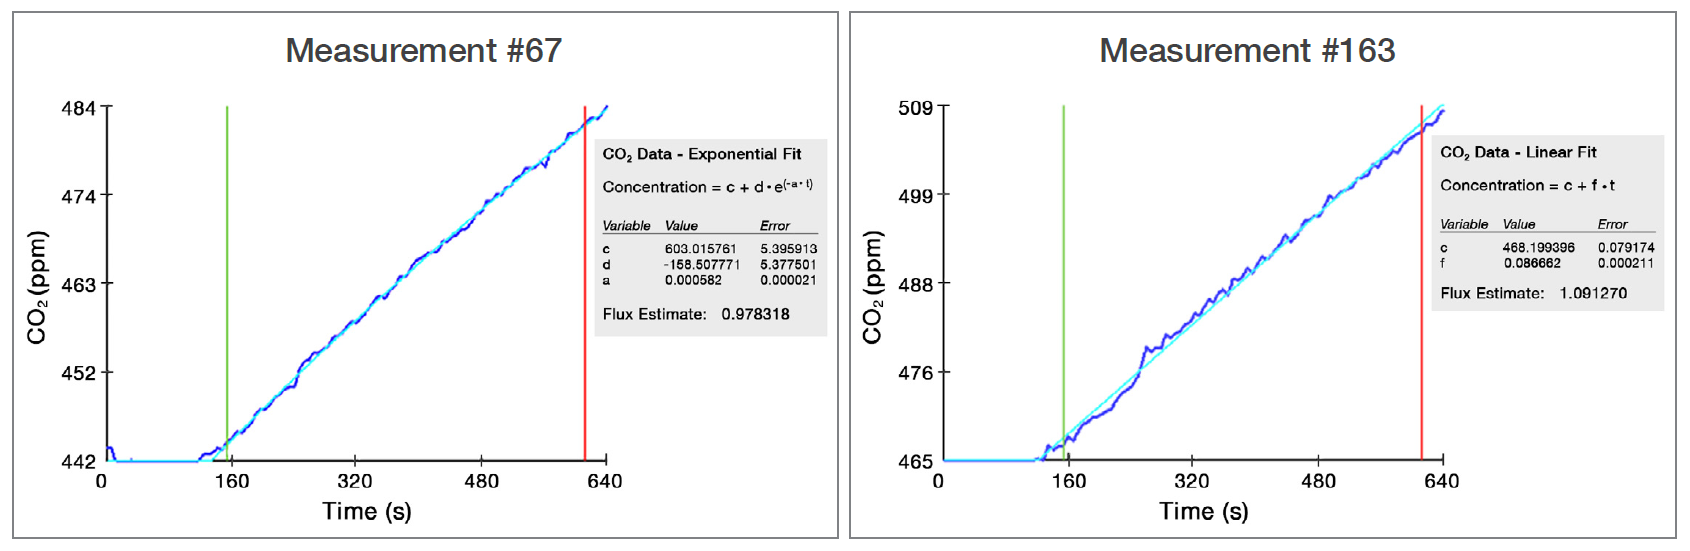
Figure 5. Example CO2 measurements shown in the Eosense flux software. Flux values (μmol m-2 s-1) taken one day apart in the same location with a 15 cm collar (left)
and a 30 cm collar (right). Software outputs included both linear and exponential fits-- best fits can be determined in post processing.
Sampling Validation and Future Results
We observed similar flux measurements between the two collar heights during similar soil and climatic conditions (Figure 5), suggesting that the differences in collar height do not significantly influence soil flux measurements. The modifications described above have helped us collect more than three years of continuous flux measurements from these periodically flooded environments. These measurements have highlighted hot moments of net CH4 and N2O flux that would have been missed with other measurement methods. The findings will help provide a more thorough annual greenhouse budget for flood-irrigated agriculture.
Users wishing to read about this study in greater depth may find a preliminary one year summary in Hemes et al,
References
Eosense. (n.d.). AN003: eosAC/eosMX and Picarro analyzer quick setup Introduction: 3–5.
Eosense. 2016. eosAC Autochamber and Software User Manual.
Hemes, K, S. Chamberlain, E. Eichelmann, T. Anthony, A. Valach, K. Kasak, D. Szutu, J. Verfaillie, W. Silver, and D. Baldocchi. 2019. Assessing the carbon and climate benefit of restoring degraded agricultural peat soils to managed wetlands. Agricultural and Forest Meteorology 268 202-214.
Linquist, B., K. J. Van Groenigen, M. A. Adviento-Borbe, C. Pittelkow, and C. Van Kessel. 2011. An agronomic assessment of greenhouse gas emissions from major cereal crops. Global Change Biology 18:194–209.
Nickerson, N. 2016. Evaluating gas emission measurements using Minimum Detectable Flux (MDF). White Paper.
O’Connell, C. S., L. Ruan, and W. L. Silver. 2018. Drought drives rapid shifts in tropical rainforest soil biogeochemistry and greenhouse gas emissions. Nature Communications 9:1348.
Oertel, C., J. Matschullat, K. Zurba, F. Zimmermann, and S. Erasmi. 2016. Greenhouse gas emissions from soils - A review. Chemie der Erde - Geochemistry 76:327–352.