At Picarro, we enjoy hearing how research groups are using our systems in their projects. Anna Kozachek of the Arctic and Antarctic Research Institute (AARI), Saint Petersburg has taken time to write a description of her team’s use of the Picarro L2130-i and L2120-i during the Antarctic Circumnavigation Expedition (ACE) project.
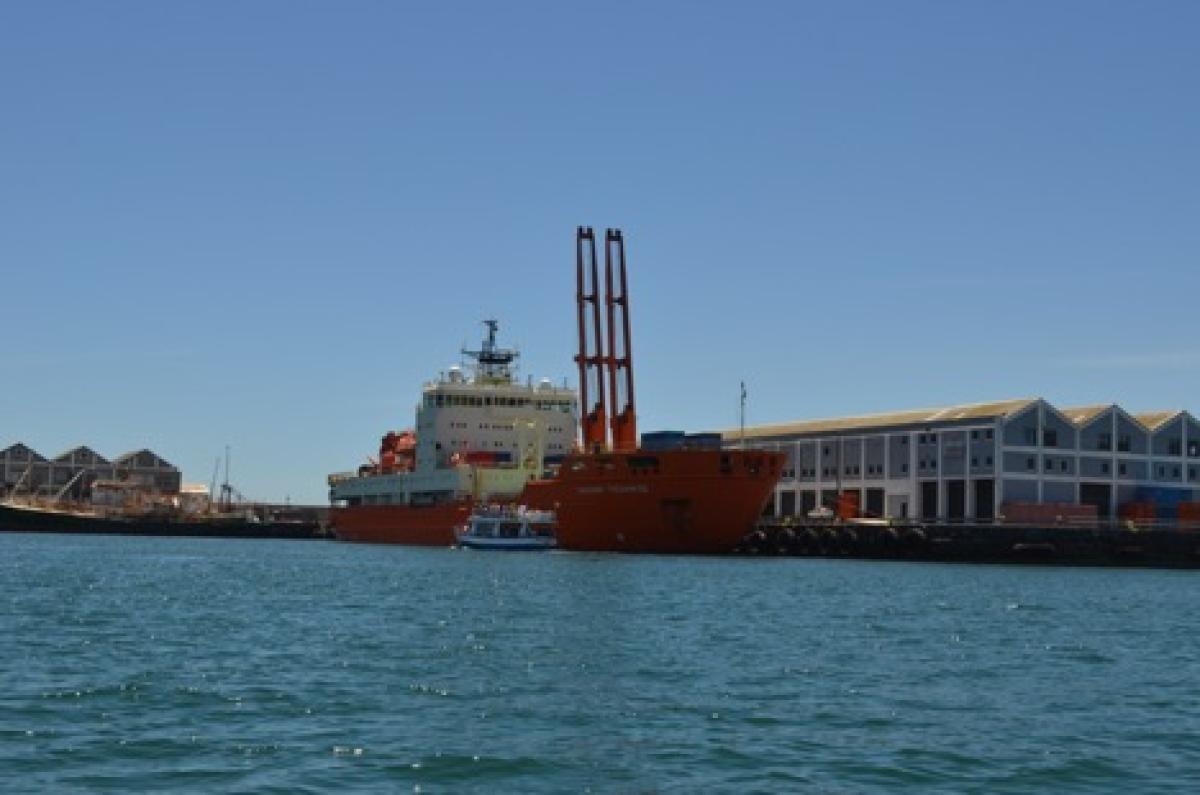
The Antarctic Circumpolar Expedition (ACE) was organized by the ACE foundation, the Swiss Polar Institute, and the Arctic and Antarctic Research Institute (AARI, Saint Petersburg, Russia). The expedition was held on board the Akademik Tryoshnikov Russian research vessel (Fig. 2).
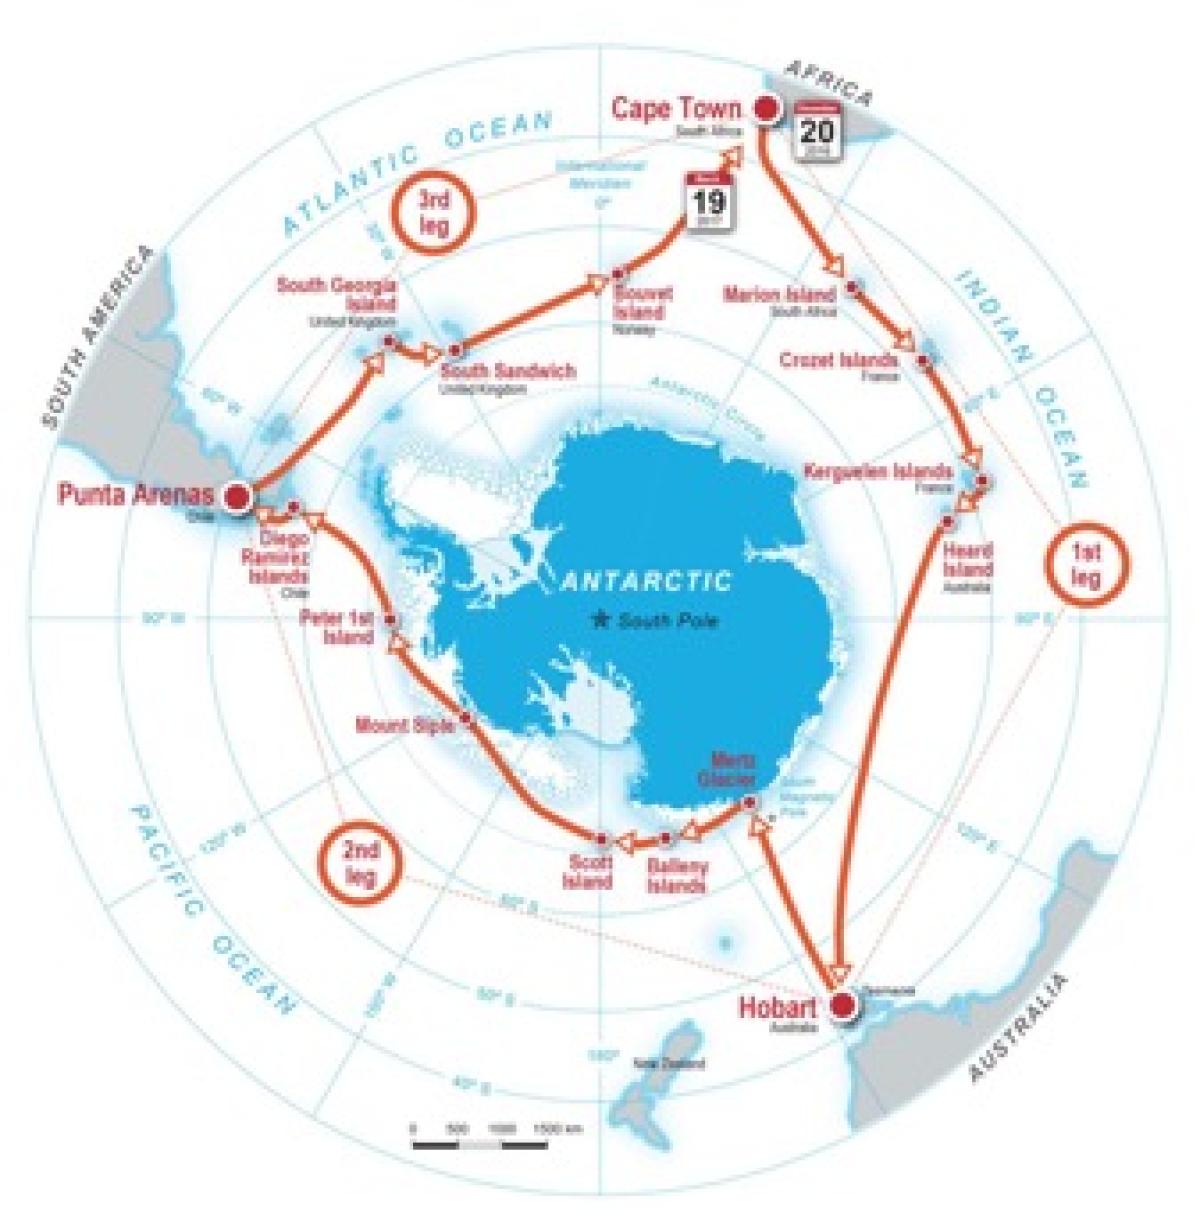
The main goal of the expedition was to circumnavigate Antarctica, performing oceanographic and meteorological observations along the route as well as terrestrial observations on the sub-Antarctic and Antarctic islands. The expedition started in Cape Town, returning 92 days later. The detailed route is shown in Fig. 3.
The expedition included 22 projects which were carried out by 55 scientists from seven different countries. The AARI project, entitled ‘Evolution of the Sub-Antarctic island ecosystems and its modern conditions’, covered several research topics including sampling of the lake sediments, sampling of soil on the islands, geomorphologic observations of past changes in sea level, measurements of aerosols in the atmosphere, and the isotopic composition of atmospheric water vapor.
The main research task of our laboratory (Climate and Environmental Research Laboratory, AARI) is the study of paleoclimate from ice core data. In the absence of a long-term weather station in Antarctica, the only way to document the high frequency climate changes of the last centuries is to measure the water stable isotopic composition in shallow ice cores at different locations in Antarctica. However, the water stable isotopic records cannot directly be translated into climatic parameters as temperature. Indeed, even if the isotopic composition (δ18O or δD) of the snow in Antarctica is linked at first order to the temperature of precipitation, it is also strongly influenced by the source and trajectory of the air mass precipitating in the different regions of Antarctica. It is thus essential to constrain the isotopic composition of the water vapor in the water mass surrounding Antarctica before it enters the continent. A similar study has been initiated for the Greenland region with important outputs for the understanding of the climate system (Steen-Larsen et al. Clim. Past, 10, 377–392, 2014).
To complement the water vapor analyses, we also plan research of the snow, firn and ice isotopic composition on island glaciers. Snow pits and shallow cores obtained on glaciers will be studied. The sampling resolution will be chosen according to snow accumulation rate on every island to obtain information on interannual changes of the isotopic composition.
Setup
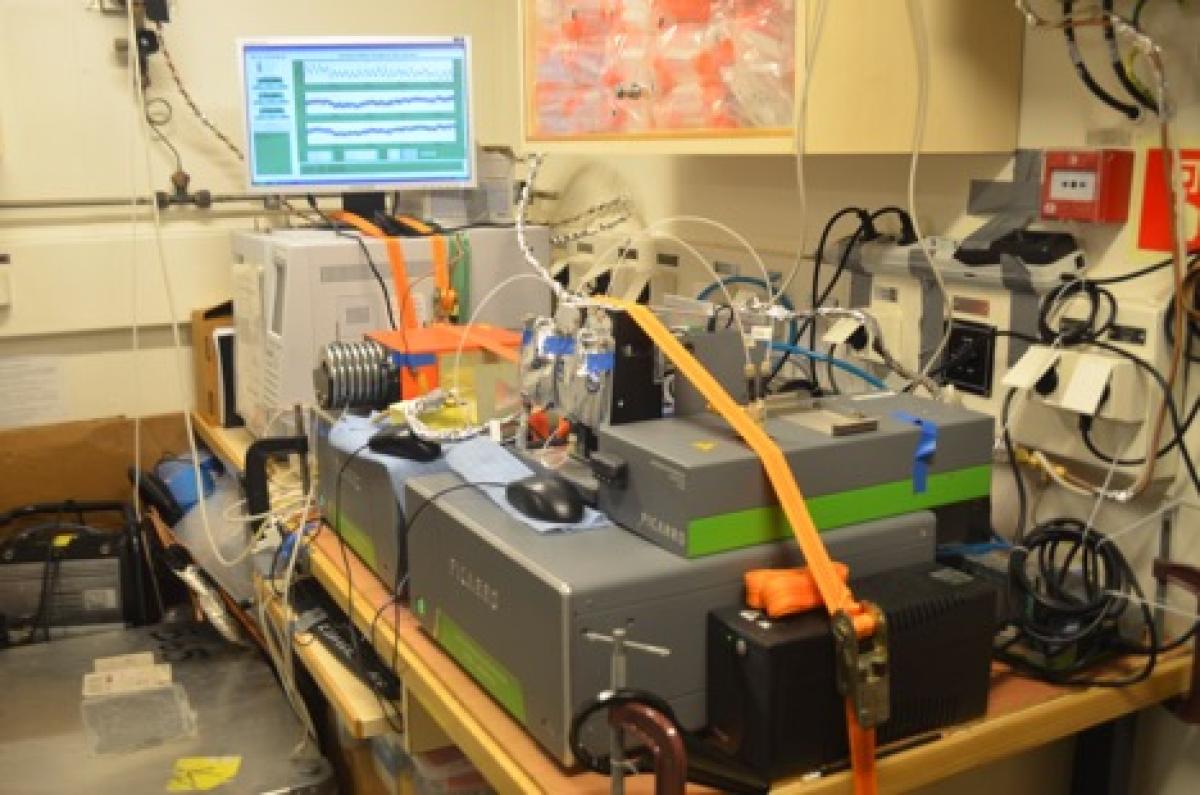
For the measurements of the vapor isotopic composition, we used Picarro instruments. We conducted the measurements on the way from the Akademik Tryoshnikov’s departure point in Bremerhaven (Germany), returning to Bremerhaven, i.e. including the Atlantic transect as well as the ACE project journey. On the way from Bremerhaven to Hobart we used only one instrument, the Picarro L2120-i from AARI - coupled with the calibration device described in Steen-Larsen et al., Atmos. Chem. Phys., 14, 7741–7756, 2014 provided by the University of Copenhagen. From Hobart to the second call at Cape Town, we also used our Picarro L2130-i and the Picarro SDM (Fig. 1 shows the installation).
This enabled us to use two air inlets at different sides of the ship, and avoid gaps in the measurements due to calibrations; although, several times the instruments were calibrated simultaneously with the same vapor from the home-made calibration device.
We used two air inlets situated on the main deck of the ship i.e. about 10 meters above the sea level. The inlets were situated on starboard and portside of the ship. For the inlets, we used copper tubes ¼” in diameter. The tubes were heated to 50 °C to avoid condensation of the vapor inside. We also used extra pumps to quicken delivery of air from outside to the analyzer.
Results
The obtained data is being analyzed together with the weather observations along the route (air temperature, relative humidity, and wind speed and wind direction) as well as air mass trajectories data. Here, we can provide preliminary results. Above the Atlantic Ocean, the isotopic composition of the water vapor changes according to changes in the climatic zones. Above the Antarctic Ocean, the variability of this parameter depends strongly on local weather conditions.
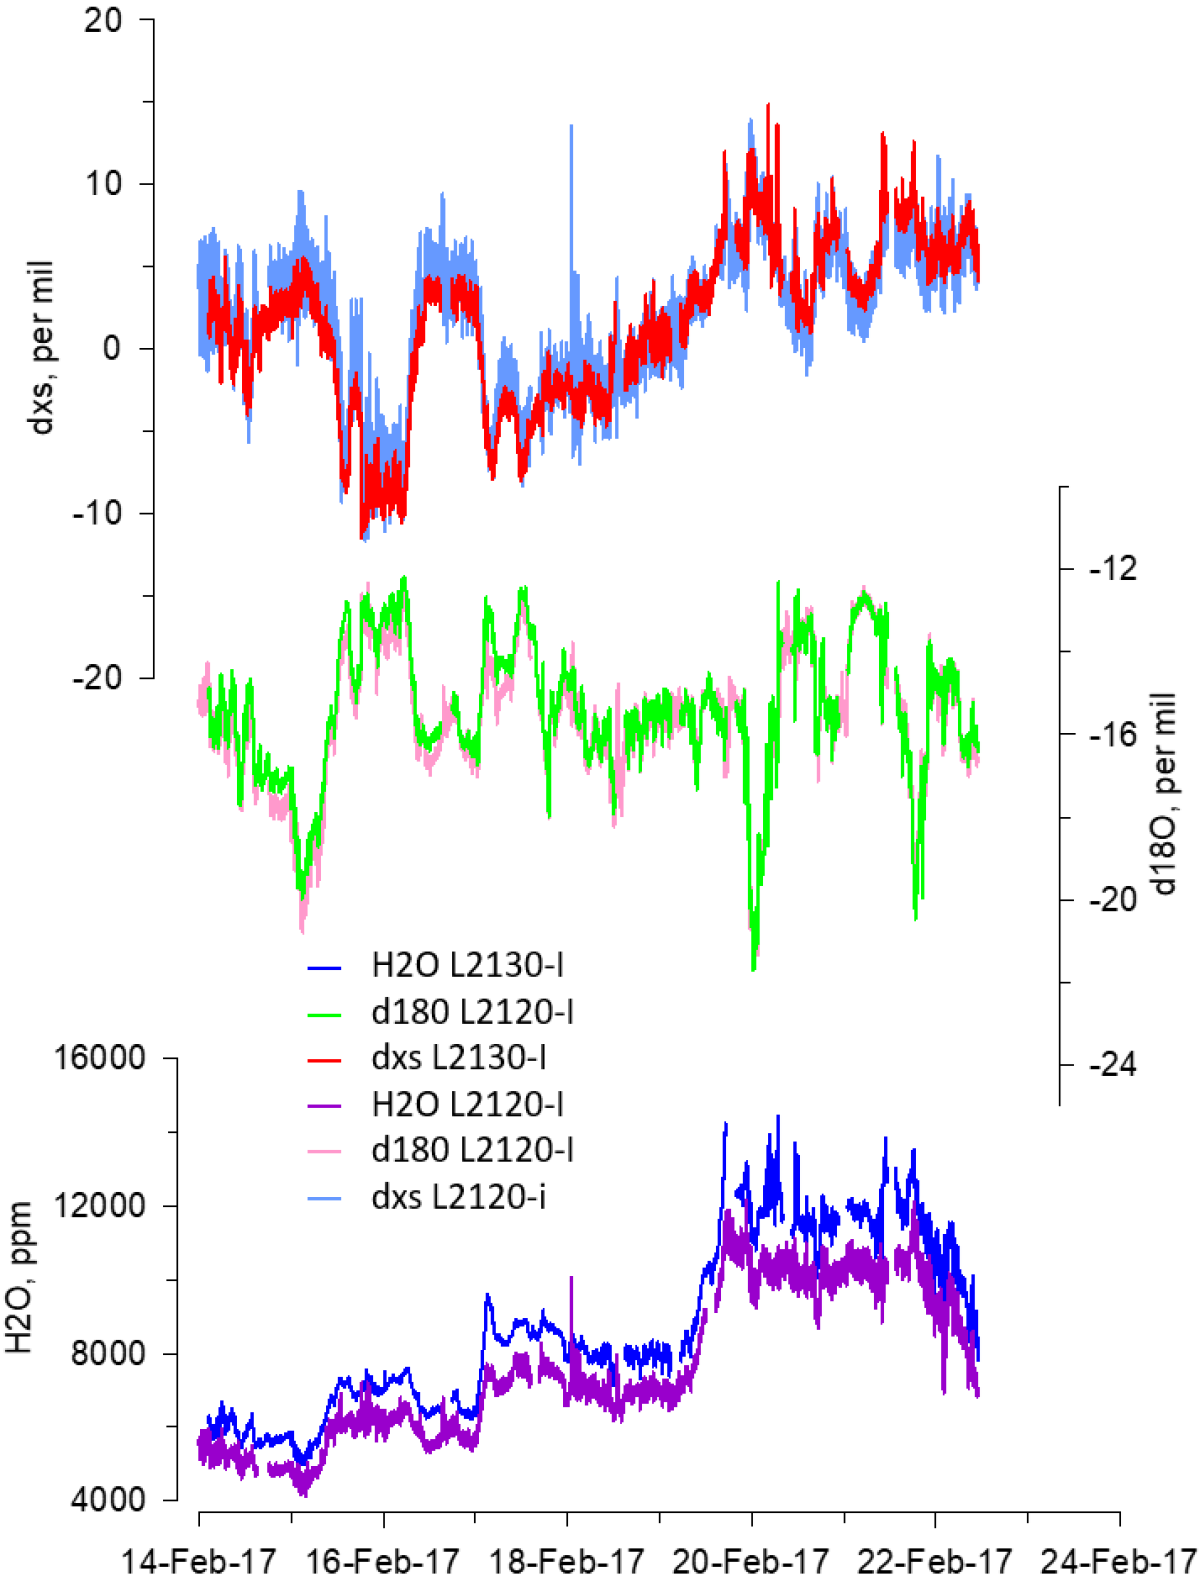
In total we obtained about 10 million data points. As an example of the dataset we show isotopic composition of the water vapor along the route from Antarctica to Punta Arenas (Fig. 4).
As shown on the graph, the Picarro L2130-i is more accurate than L2120-i. It is more evident when d-excess graphs are compared. Moreover, Picarro L2130-i performs better then L2120-i when the air humidity is much lower than the sensitivity range of the instrument.
Two calibration devices were used for calibrating the Picarro analyzers, the Picarro SDM and the home-built system. During the voyage, we found several pluses and minuses of them. First and foremost, the Picarro SDM is much more user-friendly compared to the home-made device. However, it is prohibited by software to calibrate the instrument at humidity level higher than 24000 ppm, which is much lower than the humidity at equator (Ed note: I think it’s actually 30,000 ppm – and I acknowledge yours and other marine vessel research studies have plotted d18O and dD to over 40,000 ppm H2O – ig). Another point is the possibility to use home-made device for simultaneous calibration of several instruments which is not possible with the SDM.
Finally, we would like to mention that during the expedition all Picarro equipment worked perfectly so that we were able to fulfill the program of the measurements.
Picarro provides tools which support field- and laboratory-based research efforts in characterizing climate change over time. Ice core data extends about 123,000 years in Greenland and 800,000 years in Antarctica. Developing ever more complete climate models from this rich record requires additional data from water vapor and surface ice research gathered from oceanic and terrestrial observations.


