By Guest Bloggers Stephen Good and Gabe Bowen:
Well, we’re approaching the two-year anniversary of Hurricane Sandy, and we figured it would be a good time to reminisce about that intensive sample storm that swirled through our Utah lab after the floodwaters of Sandy subsided in New Jersey …
The idea behind conducting large-scale isotope research during what turned out to be the most devastating Atlantic Hurricane since Katrina didn’t just fall out of the sky. For decades climate scientists have recognized that stable isotope ratios of water trace pathways of water cycling within the atmosphere, and water isotope samples have been used to study ocean-atmosphere and land-atmosphere exchange, atmospheric vapor transport, and condensation processes. We were curious whether such samples, if collected over adequate reaches of space and time, might help reveal the inner workings of major storm systems – the flows and exchanges of energy and moisture that underlie numerical weather models but are usually under-constrained by observational data.
In 2011, our lab and about 50 colleagues attempted the first rapid-response crowd-sourced isotope science (that we know of) during a Groundhog Day storm that swept across the East Coast. In total, about 100 samples were collected as an intense cold front dumped snow across central and eastern USA and Canada. These first samples provided a tantalizing glimpse into the isotopic evolution of a large storm system, and these data are available at http://www.waterisotopes.org. As Sandy began to move northward out of the Caribbean, it became clear that this dangerous storm might also be a windfall for isotope science.
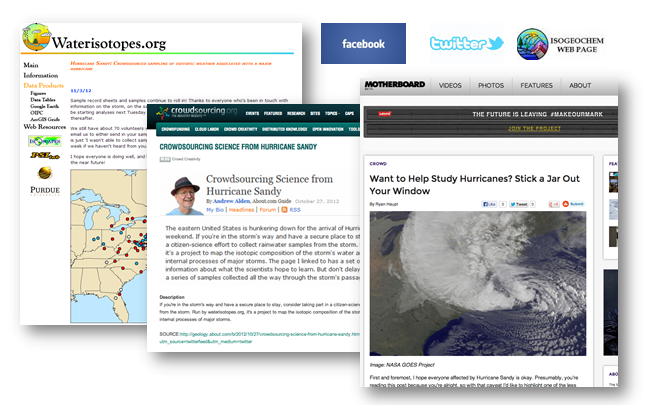
Excellent forecasting by NOAA and other organizations gave us the lead-time we needed to enlist a swarm of volunteers to collect precipitation samples during Sandy. Colleagues were emailed, list-serves were contacted, Facebook was posted to, tweets were tweeted, and we created a blog. The response from both within the scientific community and the public at large blew us away, as the Internet community picked up the project and spread the word. Details and hyperlinks were forward on, re-tweeted, and covered by crowd-sourcing and science websites.
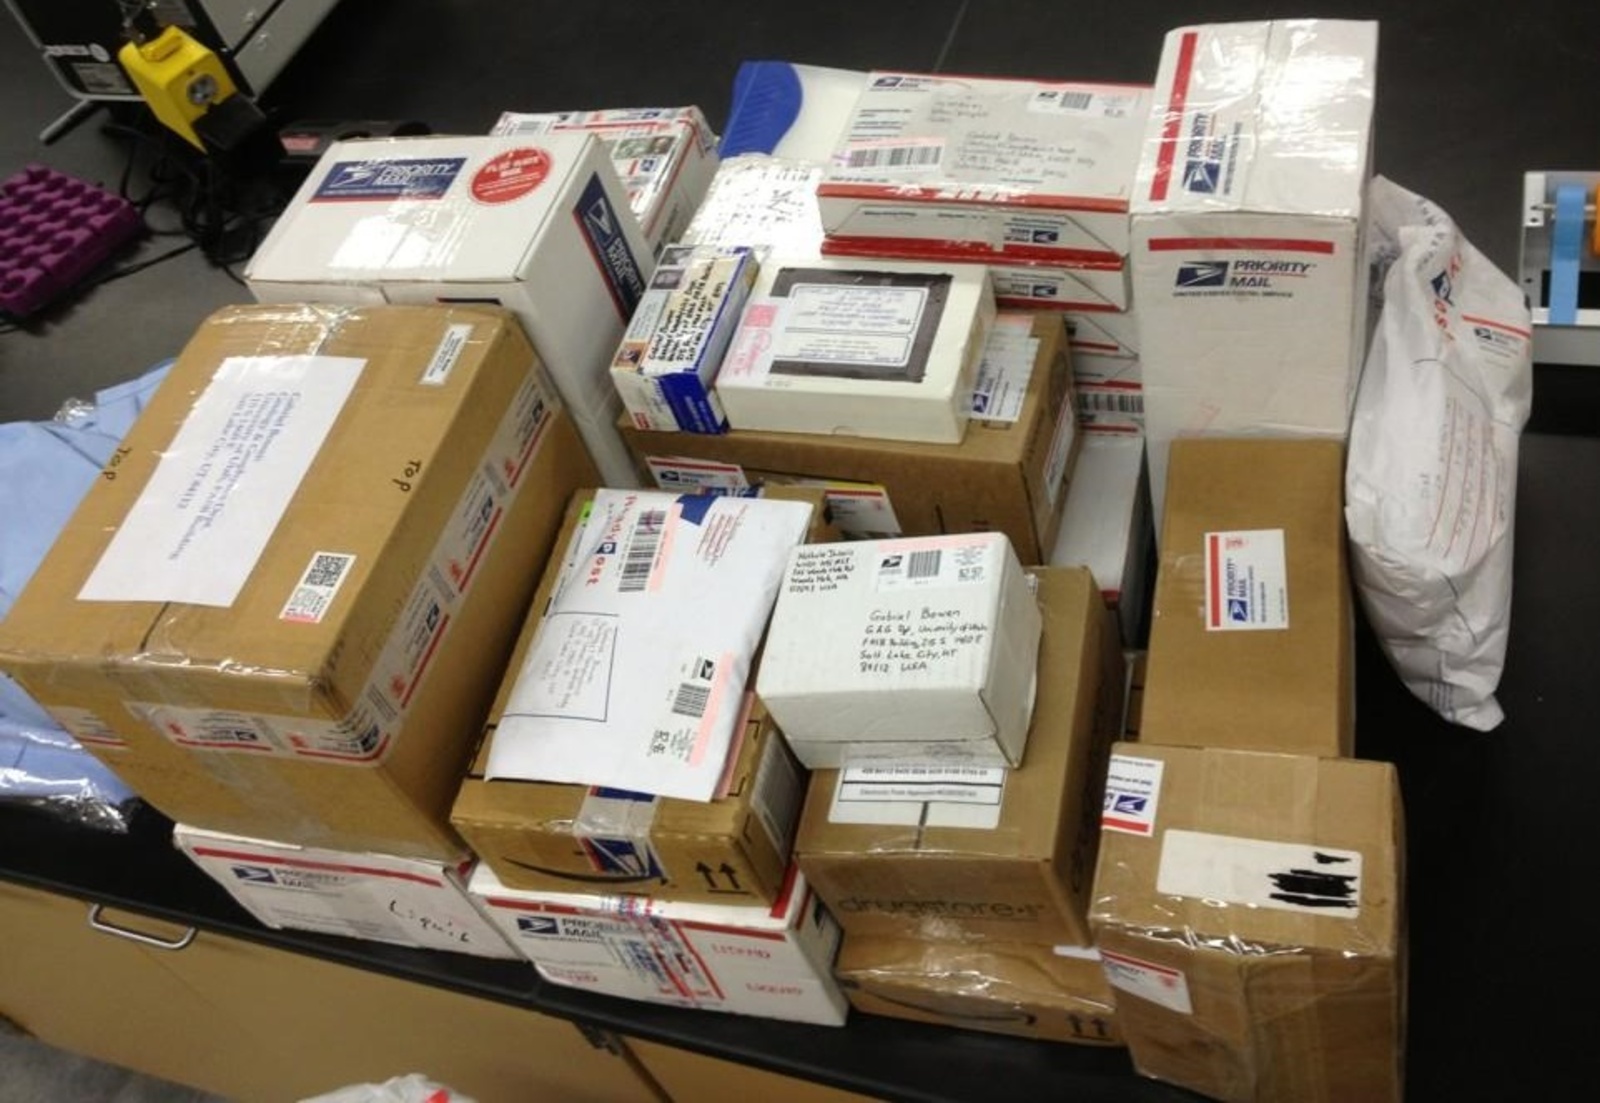
After the storm subsided, samples began flooding into our lab at the University of Utah, and our administrative staff was inundated with boxes shipped in from all over the eastern United States. Over the weeks following the storm, this deluge totaled 685 samples from more than 125 volunteers (thank you all!). Both in terms of sample number and the spatial and temporal coverage, this constituted the largest, most complete isotopic sampling of a synoptic-scale storm ever. Simple instructions and a sample spreadsheet were posted on our blog, which helped our volunteers supply the necessary meta-data needed for science. Samples were collected in containers ranging from wheel-barrows to shampoo bottles to more conventional Isco samplers and polypropylene bottles. The panoply of approaches made it easy for volunteers to collect samples but also raised the possibility of sample quality issues - a quality screening protocol removed a small number of samples stored in containers that were not clean, poorly sealed, or had leaked, and post-analysis cross-checks between the large number of samples collected confirmed that few problems remained.
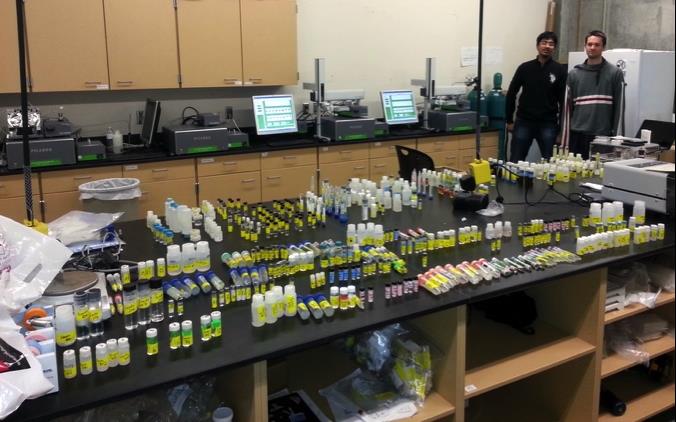
Our unanticipated crowdsourcing success left our lab technicians and graduate students drowning in samples. This is where our Picarro L2130-i analyzers came into play. Crystal Tulley-Cordova, Yusuf Jameel, and Dan Davis took turns setting up analyses, the instruments worked around the clock, and we started making serious headway gathering data. Although we had several analyzers assigned to various projects in the lab, only one of these was equipped with a liquid water autosampler. We quickly realized that to get the rapid turnaround we desired for the project we needed to expand our throughput, and were delighted that the staff at Picarro was willing to work with us to expedite an order for a second autosampler. Within a week this peripheral was purchased, shipped, installed and tested, and with two analyzers working side-by-side the rest of the work was a breeze!
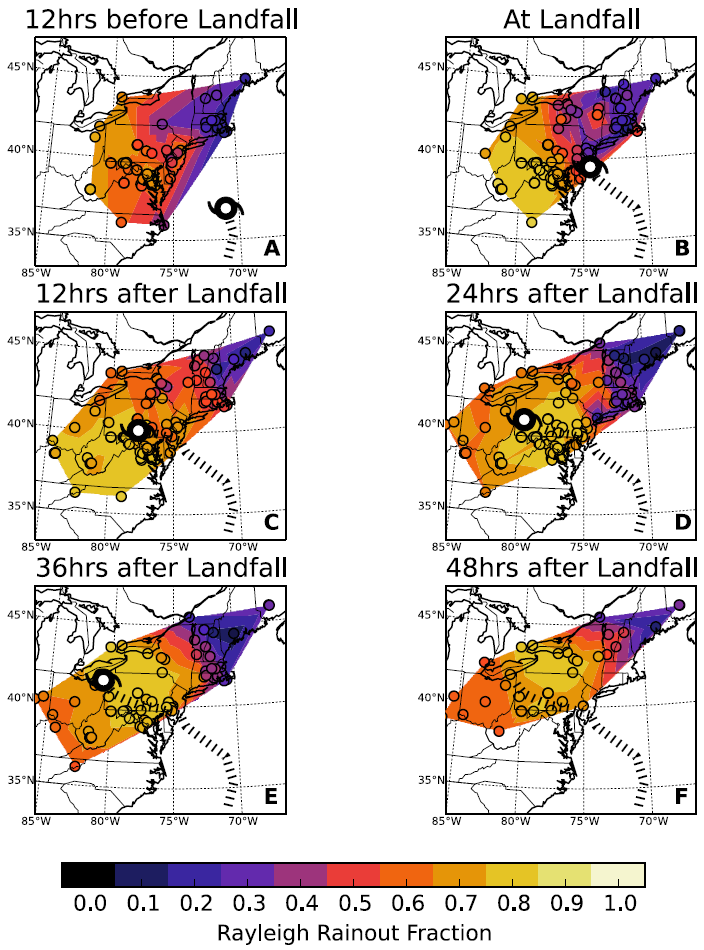
The quick processing of our samples allowed us to start investigating the isotopic data lightning fast. Even during the early stages of analysis the data revealed very strong spatio-temporal structure in the isotopic composition of Sandy’s precipitation, indicating that significant information on moisture cycling within the system was recorded in the isotope samples. We combined the completed isotope dataset with Lagrangian back-trajectory modeling conducted by Derek Mallia and John Lin from the Atmospheric Sciences department here at the University of Utah. This allowed us to estimate vapor source conditions for the collected precipitation samples, a key step in using the data in quantitative analyses. Among the results of this work, we found the isotopic distillation in the collected samples tracked the intensity of the storm’s warm core, indicating that the rainout ‘efficiency’ of the system was closely linked to the strength of the large-scale organized circulation. Our data also showed a region of very high deuterium-excess values associated with heavy, late-storm rains in New England, which we were able to link to the moistening of dry continental air entrained from a mid-latitude trough. At the beginning of this year, our results were published in the open access journal PLoS One (Good 2014a), with another more detailed book chapter coming soon (Good2014b). By pursuing an open access format all those who contributed to the collection effort have access to both the data and the scientific conclusions of the project, a fitting end for a community-supported project.
Sorry for all the terrible weather puns, they were just pouring onto the page!
References:
Stephen P. Good, Derek V. Mallia, John C. Lin, and Gabriel J. Bowen (2014a). “Stable isotope analysis of precipitation samples obtained via crowdsourcing reveals the spatiotemporal evolution of Superstorm sandy”. PLoS ONE, 9(3): 1–7(DOI:10.1371/journal.pone.0091117)
Stephen P. Good, Derek V. Mallia, Elizabeth H. Denis, Katherine H. Freeman, Xiahong Feng, Shuning Li, Nicolas Zegre, John C. Lin, and Gabriel J. Bowen (2014b, in Press). “High-density spatiotemporal monitoring of water transport in Hurricane Sandy using stable isotopes”. In J. Bret Bennington and E. Christa Farmer, editors, Learning from the Impacts of Superstorm Sandy, chapter 4. Elsevier.