By David Kim-Hak, Product Manager
Delta Cruise Part I
In the fall of 2014, Picarro had the opportunity to take the new Continuous Water Sampler (CWS) out for a spin on the Sacramento-San Joaquin River Delta. After introducing our local collaborator, Carol Kendall from the U.S. Geological Survey (USGS) in Menlo Park, to the concept of the CWS, she cooked up a great plan for us to join Brian Bergamaschi and Bryan Downing from the USGS California Water Science Center in Sacramento on one of their upcoming delta mapping trips. Brian and Bryan frequently head out to this important delta to map nutrient dynamics and residence time of the water, and we were all excited to see what real-time, in situ water isotope measurements could bring to the table.
The Sacramento-San Joaquin River Delta located in Northern California is one of the largest estuaries in western North America. It is formed by the confluence of the Sacramento River from the north and the San Joaquin River from the southeast. The Delta is a vital source of fresh water for California as it is exported to the San Francisco Bay area, San Joaquin Valley, Central Coast and Southern California to supply farmland and people. In recent years, the Sacramento Delta has been endangered by the California drought, environmental problems, declining fish population, and aging levees.
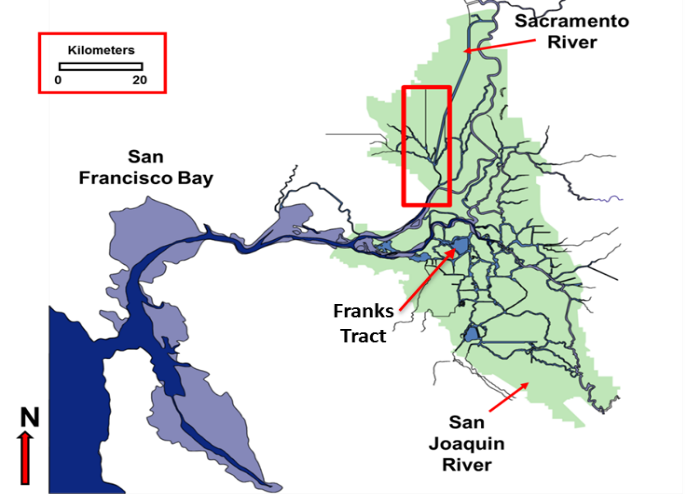
Figure 1: The Sacramento-San Joaquin River Delta. The red box highlights the area mapped in October 2014.
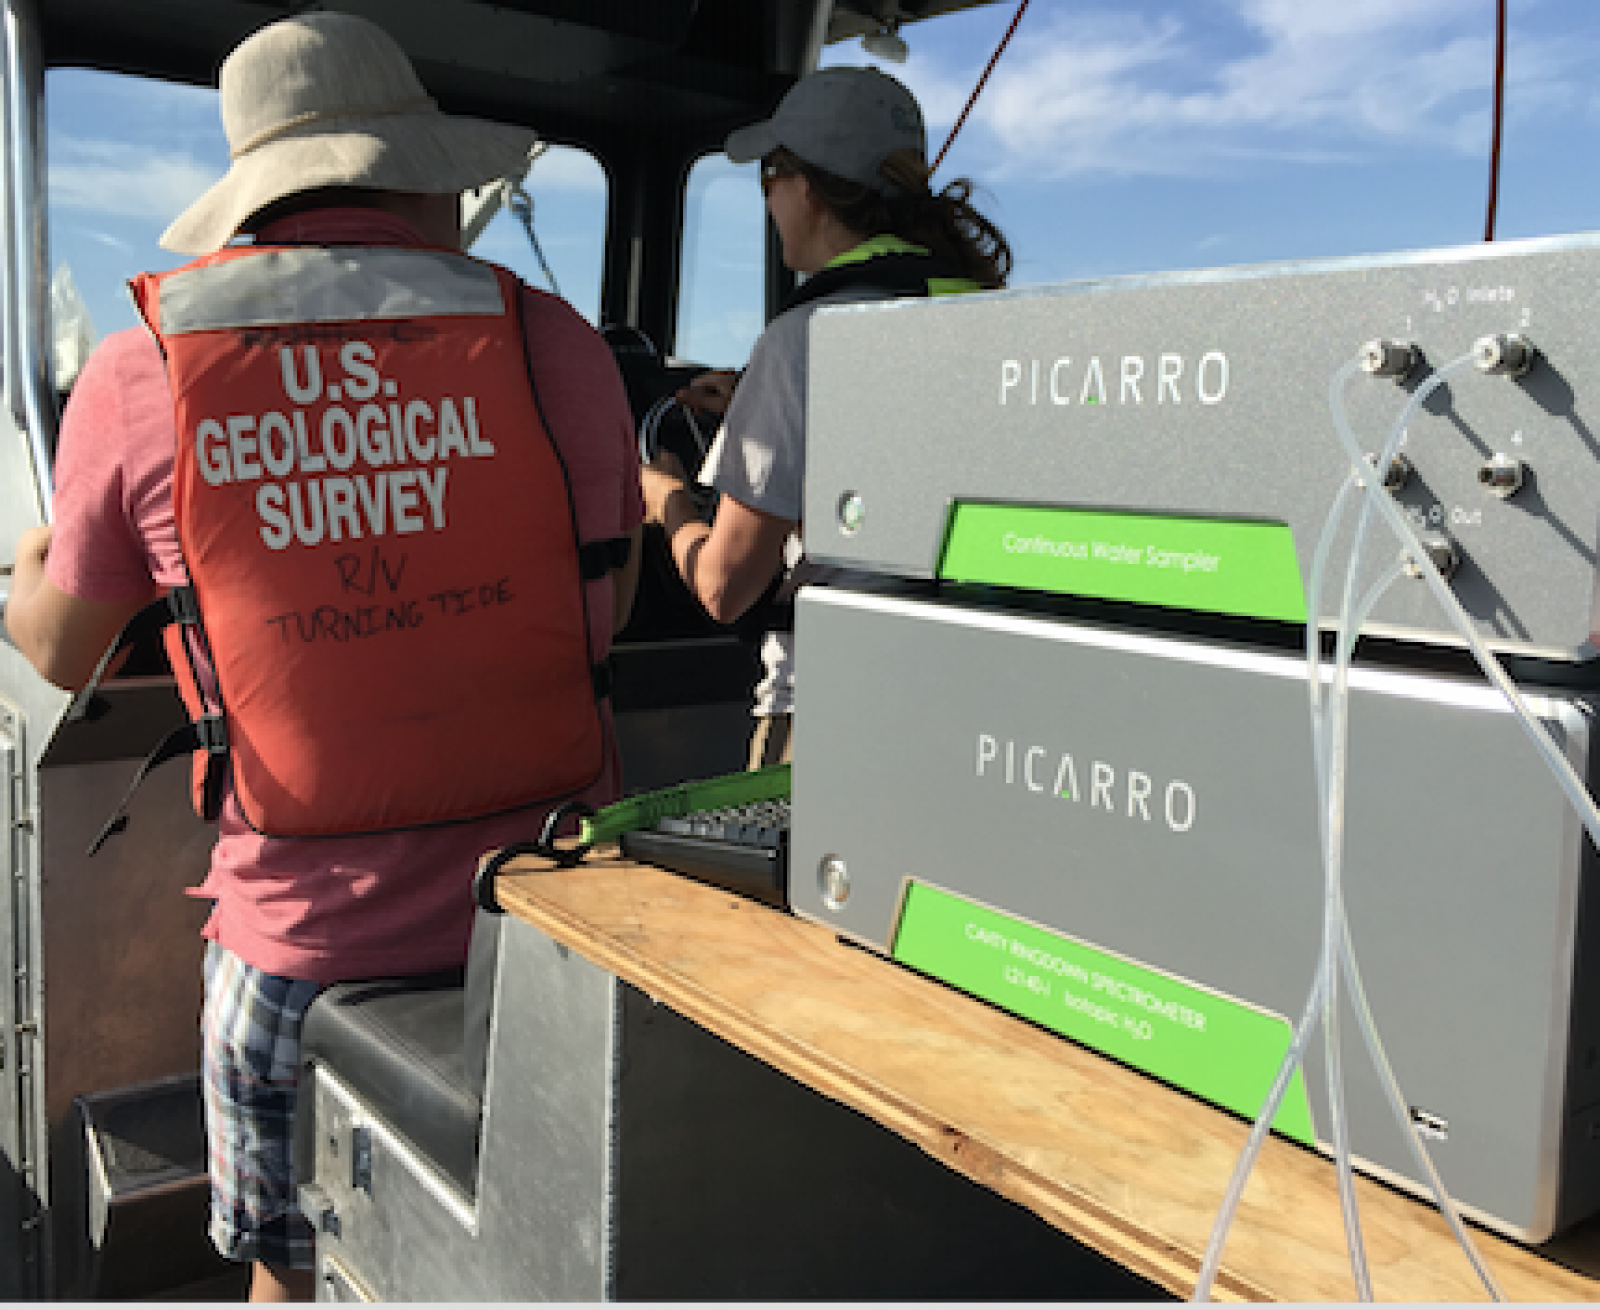
On October 1st, 2014, Kate Dennis and Jeff Carter from Picarro joined Brian, Carol and Bryan on a 6-hour cruise on the USGS-owned R/V Landsteiner (26’ boat) where a CWS combined with a Picarro L2130-i provided real-time continuous measurement of δ18O and δ2H. This was the first-time Picarro’s new peripheral, the CWS, was deployed on a boat, and Kate and Jeff were eager to see how it performed. In addition, USGS had their standard suite of real time, high frequency instrumentation to measure nitrate, fluorescent dissolved organic matter (fDOM), chlorophyll-a fluorescence (fCHLA), blue green algae fluorescence (phycocyanin pigment), temperature, dissolved oxygen, and ancillary water quality parameters at high boat speeds (10-30 mph) at 1 Hz sampling frequency.
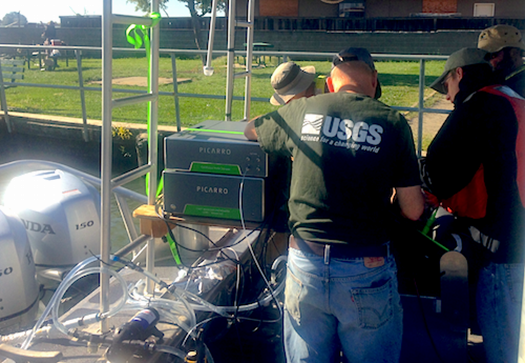
Figure 2: Setting up the CWS on the R/V Landsteiner in October 2014.
Results from this cruise showed great promise for the CWS both scientifically, and as a robust and durable way to measure water isotope continuously in the field. If you are interested in reading more about the science, see our poster presented at the IAEA Isotope Hydrology Symposium in May 2015.
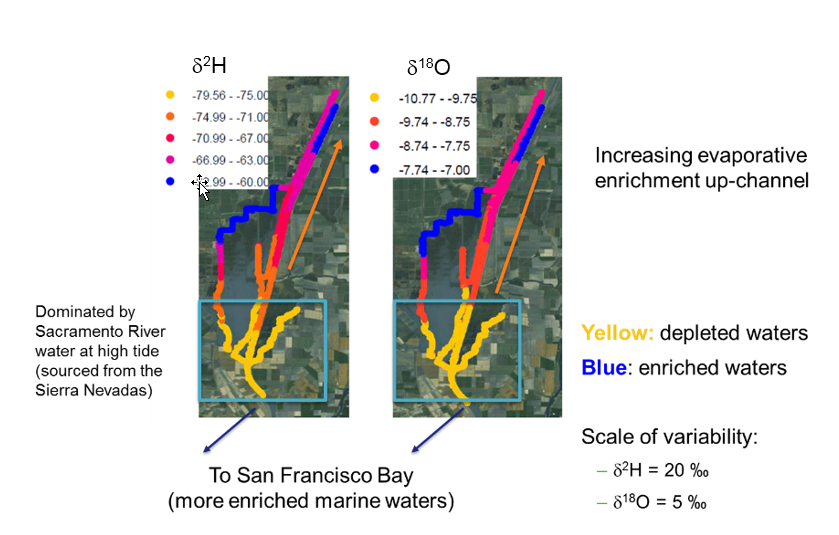
Figure 3: Here's a teaser of the results from the first cruise. You can learn more about the results in this poster presented at the IAEA Isotope Hydrology Symposium in May 2015.
Delta Cruise Part II
In August 2015, Brian and Bryan contacted us for a second collaboration to repeat the water quality survey conducted the previous year. However, the objective was now to investigate the effects on the water residence time with respect to the newly installed drought barrier in Franks Tract. The approach consists of surveying specific areas around Franks Tract before and after the barrier is removed.
The Franks Tract barrier was installed in May 2015 to stop the intrusion of seawater in the Franks Tract region during the high tide season -- from June to August. The seawater intrusion phenomenon has been exacerbated in recent years because of the California drought and the low water level in Franks Tract causing an increase in salt contamination and a degradation in the water quality. However, the barrier will be removed in November before the expected flood season.
Thus, on September 10th 2015, Kuan Huang, a Picarro Application Scientist, and I, Product Manager for Picarro’s water isotope instrumentation, drove to the Delta to meet with Katy O’Donnell, Elizabeth Stumpner, and Travis von Desssonneck, all USGS scientists, for a one-day survey of the water quality. We arrived at the dock at 7:00 am and started measuring by 8:00 am as it only took 15 minutes to install and secure the CWS-CRDS analyzer system onto the boat and 45 minutes to warmup the analyzer. Katy had mapped out the itinerary for the day and pinpointed the location where additional samples needed to be taken for lab analysis. While the boat was cruising at speed up to 30 mph from one sampling location to another, the CWS system was continuously, and in real-time, sampling and measuring the water isotopic composition of the river. At each sampling location, Travis stopped the boat so that Katy and Elizabeth can collect samples in sampling bottles and record the time and the different measurements values given by all the sensors and instruments onboard.
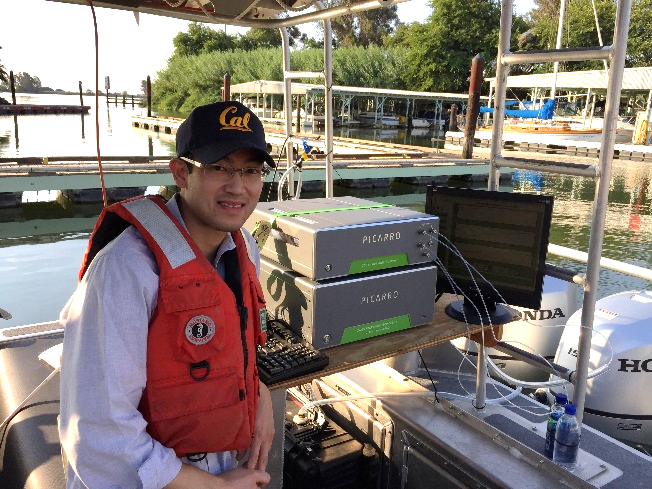
Figure 4: That's me looking after the Picarro CWS and L2130-i analyzer.
At noon, during the lunch break, we took the opportunity to conduct our only calibration of the day for the Picarro system by measuring deionized water and Kona Deep bottles. The calibrated isotopic compositions of these standards (vs. VSMOW and VSLAP) had been previously determined at the Picarro manufacturing facility and R&D lab in Santa Clara, CA.
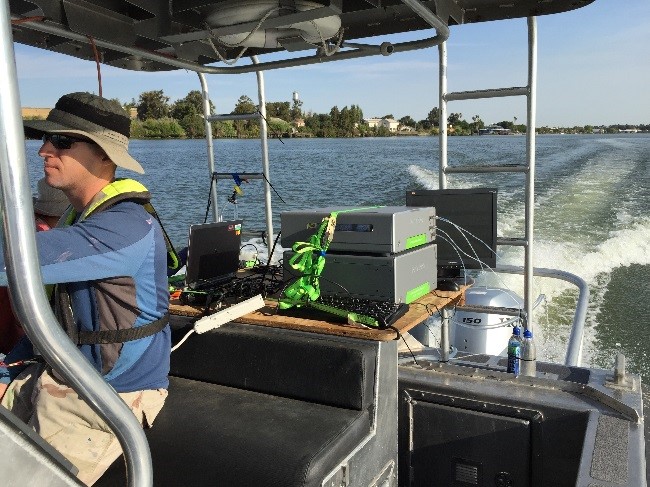
Figure 5: Travis steaming ahead with the CWS at the rear of the R/V Landsteiner. Water was pumped from the delta and then sampled directly by the CWS.
In the afternoon, we continued cruising along the river following the planned itinerary. It was a very hot and dry September day with temperature well above 100°F; however, sitting under the boat shed and by the virtue of being close to the water, the heat was slightly (!) more bearable. Except for the times when we had to read out the isotopic measurements from the Picarro analyzer CRDS Data Viewer, Kuan and I left the CWS-CRDS system un-attended.
We returned to the Marina dock by 5 pm and offloaded the equipment as fast as it was installed. Next up will be the data analysis and I’m looking forward to seeing the results once they have been mapped.
The next USGS survey on the Delta will be in November after the removal on the barrier. Unfortunately for me, I will be not be part of the cruise – instead USGS will be going out on their own with their newly purchased CWS-CRDS system!
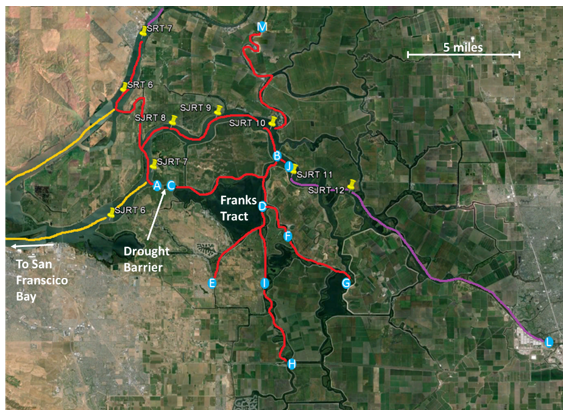
Figure 6: Map of the cruise in September 2015.
Field testing in cooperation with the USGS does not necessarily imply product endorsement by the U.S. Government.
Feel free to contact me if you have questions! - David (dkimhak@picarro.com).